
Figures & data
Figure 1 Map of the most recurrent amino acid substitutions in the BCR-ABL1 kinase domain in Ph+ clinical samples.
Notes: Highlighted mutations are the most frequent, usually associated with IM resistance. Numbering of residues is according to normal ABL1 protein. Key structural motifs within the kinase domain are indicated as follows: P-loop, phosphate binding loop; IM binding, ATP/IM binding region; C-loop, kinase catalytic domain; A-loop, activation loop; C-lobe, C-terminal lobe.
Abbreviations: IM, imatinib; Ph+, Philadelphia chromosome positive.
Abbreviations: IM, imatinib; Ph+, Philadelphia chromosome positive.
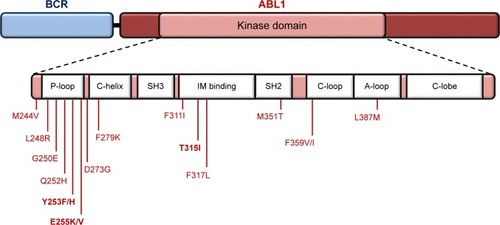
Figure 2 Cytogenetic (A) and molecular (B) analyses of Ph+ ALL patient’s bone marrow sample.
Notes: (A) Interphase FISH image depicting a Ph+ nucleus, 46,XY,t(9;22)(q34.1;q11.2), using LSI BCR/ABL1 Dual Color, Dual Fusion translocation probe. The image was provided by the Hematology Department of Hospital dos Capuchos. (B) ABL1 and BCR-ABL1 molecular analyses: (B1) control PCR amplification of ABL1 (expected amplicon size=296 bp) and (B2) nested-PCR amplification of e1a2 (P190BCR-ABL1) isoform (expected amplicon size=381 bp). PCR products (1 µL) were resolved via 2% agarose gel electrophoresis. Ladder, GeneRuler DNA Ladder Mix SM0331.
Abbreviations: ALL, acute lymphoblastic leukemia; FISH, fluorescence in situ hybridization; NTC, non-template control; Ph+, Philadelphia chromosome positive.
Abbreviations: ALL, acute lymphoblastic leukemia; FISH, fluorescence in situ hybridization; NTC, non-template control; Ph+, Philadelphia chromosome positive.
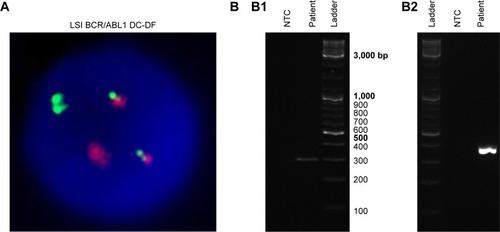
Figure 3 Ph+ ALL patient’s novel BCR-ABL1 point mutation and disease molecular monitoring.
Notes: (A) P190BCR-ABL1 protein structure indicating the position of the detected mutation. Sequencing chromatograms displaying: (A1) BCR-ABL1 nucleotide sequence from Ph+ ALL patient’s white blood cells at the time of diagnosis; (A2) BCR-ABL1 nucleotide sequence from Ph+ ALL patient’s white blood cells at day 29 after diagnosis and treatment initiation. Chromatogram peak analysis indicates that the variation is present in 20% of the total Ph+ clones; (A3) ABL1 nucleotide sequence from Ph+ ALL patient’s epithelial cells; and (A4) ABL1 from control individual (WT). P-loop: phosphate binding loop; IM binding: ATP/IM binding region; C-loop: kinase catalytic domain; A-loop: activation loop; and C-lobe: C-terminal lobe. (B) BCR-ABL1 mRNA relative quantification in bone marrow samples at the time of diagnosis and follow-up. qPCR data were normalized to ABL1 and compared to transcript levels at the time of diagnosis. Patient started induction chemotherapy and dasatinib after diagnosis. Treatment was switched to bosutinib 5 months after diagnosis and maintained for 7 weeks (until the 7-month time point).
Abbreviations: ALL, acute lymphoblastic leukemia; IM, imatinib; Ph+, Philadelphia chromosome positive; WT, wild-type.
Abbreviations: ALL, acute lymphoblastic leukemia; IM, imatinib; Ph+, Philadelphia chromosome positive; WT, wild-type.
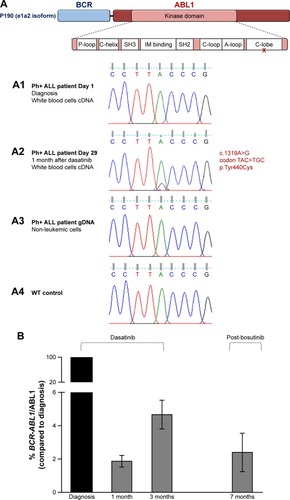
Figure S1 Alignment of Ph+ ALL patient e1a2 nucleotide sequence (Seq 1) with BCR-ABL1 e1a2 reference sequence from GenBank AF113911.1 (Seq 2).
Note: Arrow indicates the breakpoint in this BCR-ABL1 isoform.
Abbreviations: ALL, acute lymphoblastic leukemia; Ph+, Philadelphia chromosome positive.
Abbreviations: ALL, acute lymphoblastic leukemia; Ph+, Philadelphia chromosome positive.
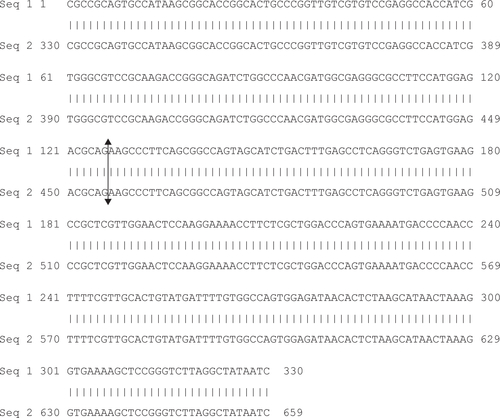
Figure S2 DISOclust disorder prediction results.
Note: Disorder probability score by residue number in BCR-ABL1 harboring the Y440C on the ABL1 domain.
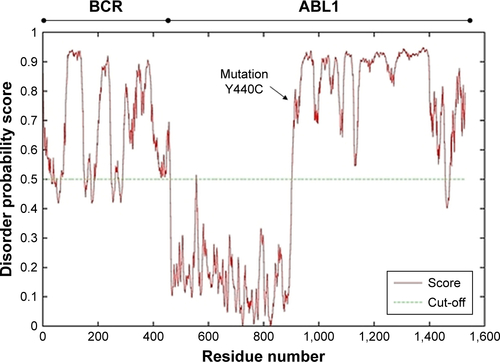
Table S1 Nested-PCR primers for the amplification of ABL1, BCR-ABL1 transcript identification and analysis of BCR-ABL1 mutational status
Table S2 ABL1 protein alignment between different species demonstrates the conservation of the affected amino acid