Figures & data
Figure 1 Expression of Nodal in bladder cancer tissues and cell lines.
Notes: (A) mRNA expression of Nodal in 63 paired bladder cancer tissue samples was analyzed by qRT-PCR. (B) IHC was employed to evaluate the expression of Nodal in bladder cancer tissues and adjacent normal tissues. Magnification: 200× and 400×. (C) Expression of Nodal in the human urothelial cell line (SV-HUC-1) and human bladder cancer cell lines (J82, SW780, 5637, T24, KMBC2, and RT4) was determined by qRT-PCR. (D) Protein expression of Nodal in the human urothelial cell line (SV-HUC-1) and human bladder cancer cell lines (J82, SW780, 5637, T24, KMBC2, and RT4) was tested by Western blot analysis. Data are presented as mean ± SD. *P<0.05 vs SV-HUC-1 cell line. ***P<0.001 vs normal tissue or SV-HUC-1 cell line. Scale bar: 100 µm for 200×, 50 µm for 400×.
Abbreviations: IHC, immunohistochemistry; qRT-PCR, quantitative real-time polymerase chain reaction.
Abbreviations: IHC, immunohistochemistry; qRT-PCR, quantitative real-time polymerase chain reaction.
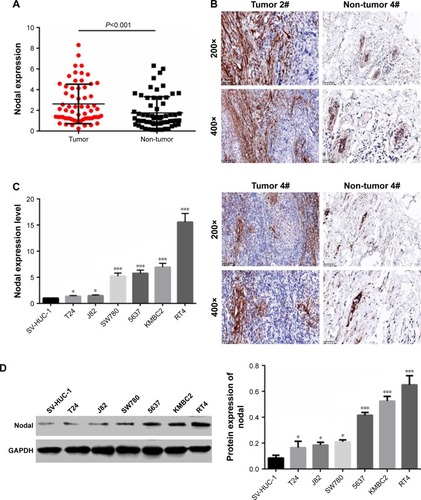
Figure 2 Downregulation of Nodal inhibited cell proliferation, migration, and invasion in bladder cancer cells.
Notes: (A and B) KMBC2 and RT4 cells were transfected with siNodal or siNC plasmids, and transfection efficiencies were determined by qRT-PCR and Western blot. (C) Cell proliferation was evaluated by MTT assay after transfection for 12, 24, 48, and 72 hours. (D) Cell cloning ability of KMBC2 and RT4 cells transfected with siNodal or siNC was determined by colony formation assay. (E and F) Cell migration and invasion were evaluated by transwell assay. Magnification: 200×. (G) Protein expression of CDC6, E-cadherin, MMP-2, and MMP-9 was examined by Western blot analysis. Data are presented as mean ± SD. *P<0.05, **P<0.01, ***P<0.001 vs siNC group.
Abbreviation: qRT-PCR, quantitative real-time polymerase chain reaction.
Abbreviation: qRT-PCR, quantitative real-time polymerase chain reaction.
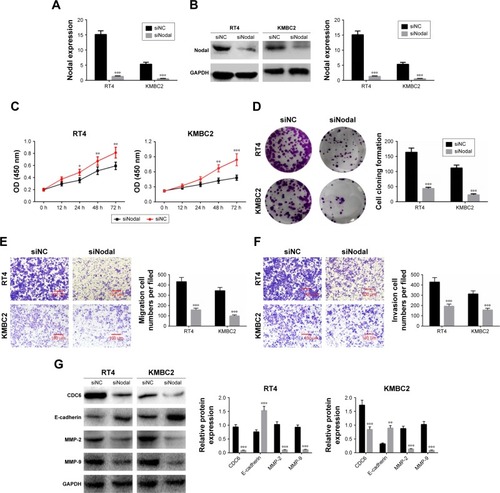
Figure 3 Silencing of Nodal blocked ALK/Smad signaling.
Notes: ALK4, ALK7, Smad2, and Smad4 expression in KMBC2 and RT4 cells transfected with siNodal or siNC was determined by Western blot analysis. Data are presented as mean ± SD. **P<0.01, ***P<0.001 vs siNC group.
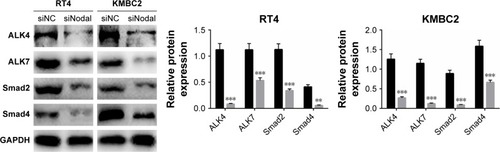
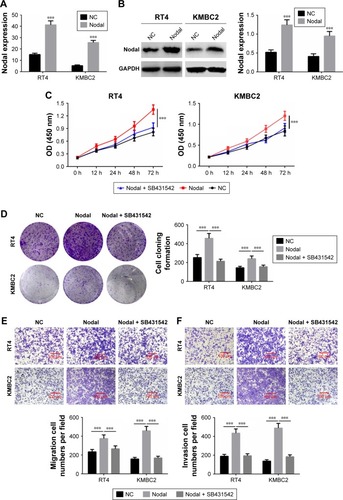
Figure 4 Nodal regulated cell proliferation, migration, and invasion via the ALK/Smad signaling pathway.
Notes: (A and B) Overexpression of Nodal in KMBC2 and RT4 cells was examined by qRT-PCR and Western blot. (C) The proliferation of cells subjected to NC transfection, Nodal overexpression transfection, and Nodal overexpression transfection + SB431542 was evaluated by MTT. (D) Clone formation ability was determined by colony formation assay. (E and F) Cell migration and invasion were evaluated by transwell assay. Data are presented as mean ± SD. ***P<0.001 vs NC group.
Abbreviations: NC, negative control; qRT-PCR, quantitative real-time polymerase chain reaction.
Abbreviations: NC, negative control; qRT-PCR, quantitative real-time polymerase chain reaction.