
Figures & data
Table 1 Comparisons of Baseline demographics and clinicopathological characteristics in patients undergoing TACE or RT before and after propensity score matching analysis
Table 2 Univariate and multivariate survival analysis of RFS and OS in HCC patients with MVI undergoing RT or TACE before propensity score matching analysis
Table 3 Univariate and multivariate survival analyses of RFS and OS in HCC patients with MVI undergoing RT or TACE after propensity score matching analysis
Figure 1 Before PSM: (A) RFS rates of the RT and TACE groups (B) OS rates of the RT and TACE groups.
Abbreviations: RT, radiotherapy; TACE, transcatheter arterial chemoembolization; PSM, propensity score matching; RFS, relapse-free survival; OS, overall survival.
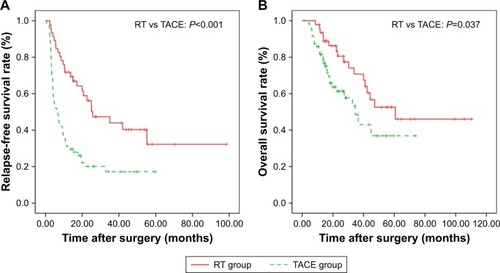
Figure 2 After PSM: (A) RFS rates of the RT and TACE groups (B) OS rates of the RT and TACE groups.
Abbreviations: RT, radiotherapy; TACE, transcatheter arterial chemoembolization; PSM, propensity score matching; RFS, relapse-free survival; OS, overall survival.
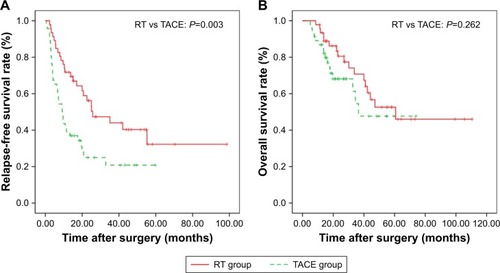
Table 4 Pattern of recurrence and treatment in the RT and TACE groups