Figures & data
Figure 1 The expression of miR-214-3p was inhibited in EC tissues and cells.
Notes: (A) The expression of miR-214-3p was measured in 22 paired ECtissues and corresponding adjacent normal tissues by qRT-PCR analysis. (B) Low expression of miR-214-3p was detected in EC cells (HEC-1-A, HEC-1-B, and RL95-2) and hEECs via qRT-PCR analysis. *P, 0.05, vs adjacent normal group, analyzed by Student’s t-test, and vs hEEC group, analyzed by ANOVA.Abbreviations: EC, endometrial cancer; hEECs, human endometrial epithelial cells; qRT-PCR, quantitative real-time PCR.
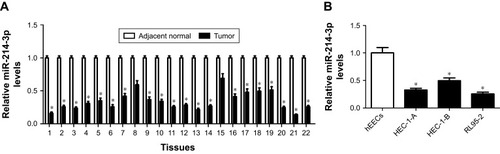
Figure 2 miR-214-3p inhibited metastasis and EMT of EC cells.
Notes: HEC-1-A cells were transfected with miR-214-3p mimic or miR-NC, and RL95-2 cells were introduced with miR-214-3p inhibitor or anti-miR-NC. (A) The expression of miR-214-3p was determined in the treated HEC-1-A and RL95-2 cells by qRT-PCR. (B and C) The numbers of migrated and invasive cells were analyzed in the treated HEC-1-A and RL95-2 cells by transwell assays. (D) The protein levels of N-cadherin and E-cadherin were measured in the transfected HEC-1-A and RL95-2 cells by Western blot. *P, 0.05, vs miR-NCor anti-miR-NC group, analyzed by Student’s t-test.Abbreviations: EC, endometrial cancer; EMT, epithelial-to-mesenchymal transition; qRT-PCR, quantitative real-time PCR.
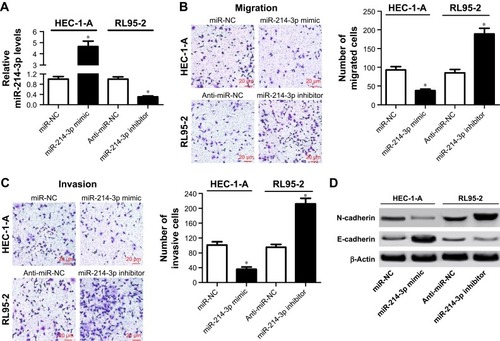
Figure 3 TWIST1 was targeted by miR-214-3p in EC cells.
Notes: (A) The potential binding sites of miR-214-3p and 3′ UTRof TWIST1 were predicted by TargetScan. (B) Luciferase activities were investigated in HEK293 cells co-transfected with TWIST1-WT or TWIST1-MUT and miR-214-3p, anti-miR-214-3p, or respective controls. (C) The expression of TWIST1 mRNAin 22 paired EC tissues and corresponding adjacent normal tissues was detected by qRT-PCR. (D) The expression of TWIST1 mRNA in EC cell lines (HEC-1-A, HEC-1-B, and RL95-2) and hEECs was examined by qRT-PCR. (E) The correlation between miR-214-3p and TWIST1 mRNA expressions in EC tissues was analyzed by Spearman correlation analysis. *P, 0.05, vs adjacent normal group, miR-NC, or anti-miR-NC group, analyzed by Student’s t-test, and vs hEEC group, analyzed by ANOVA.Abbreviations: EC, endometrial cancer; hEECs, human endometrial epithelial cells; qRT-PCR, quantitative real-time PCR; Mut, mutant; NS, No significant; WT, wild type.
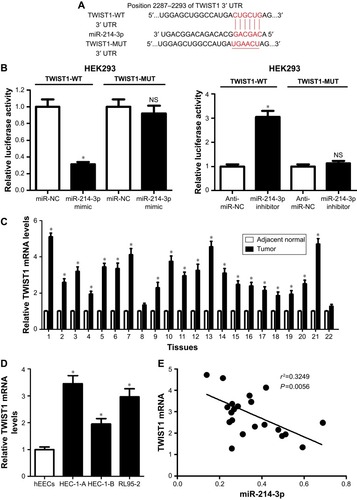
Figure 4 miR-214-3p hampered metastasis and EMT of ECcells by targeting TWIST1.
Notes: HEC-1-Acells were transfected with miR-NCor miR-214-3p mimic, alone or combined with pcDNAor TWIST1, and RL95-2 cells were transfected with anti-miR-NCor miR-214-3p inhibitor, alone or combined with si-NCor si-TWIST1. (A) The protein level of TWIST1 was determined in the transfected HEC-1-Aand RL95-2 cells by Western blot. (B and C) Transwell assays were employed to evaluate migration and invasion abilities in the introduced HEC-1-Aand RL95-2 cells. (D) Western blot was carried out to detect the protein levels of N-cadherin and E-cadherin in the transfected HEC-1-Aand RL95-2 cells. *P,0.05, vs miR-NCor anti-miR-NCgroup, analyzed by ANOVA.Abbreviations: EC, endometrial cancer; EMT, epithelial-to-mesenchymal transition.
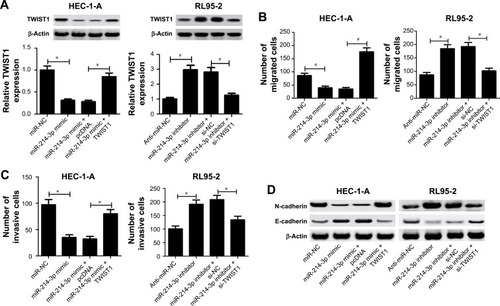
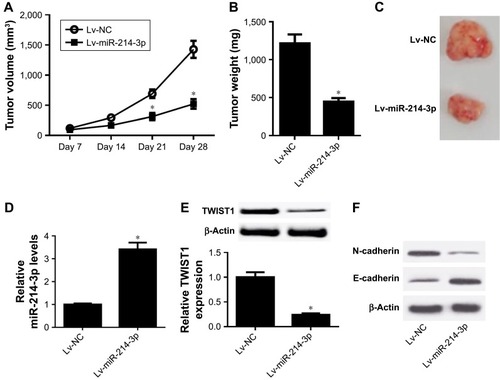
Figure 5 miR-214-3p inhibited tumor growth and EMT in EC in vivo.
Notes: The xenograft mouse model of EC was established through subcutaneously injecting with HEC-1-Acells stably transfected with Lv-miR-214-3p or Lv-NC into nude mice. (A) The tumor volume was monitored every 7 days by a digital caliper. (B and C) Tumor was photographed, and its weight was detected at the end point. (D) The expression of miR-214-3p in the xenografted tissues was examined by qRT-PCR. (E and F) The protein levels of TWIST1, N-cadherin, and E-cadherin were determined by Western blot. *P, 0.05, vs Lv-NC group, analyzed by Student’s t-test.Abbreviations: EC, endometrial cancer; EMT, epithelial-to-mesenchymal transition; qRT-PCR, quantitative real-time PCR.