Figures & data
Table 1 Association of miR-129-5p with clinicopathological features of 30 prostate cancer patients
Figure 1 Downregulation of miR-129-5p in prostate cancer tissues and cell lines.
Notes: (A) Through analysis of miRNA profiling in GSE60117, miR-129-5p was one of the most significantly downregulated miRNAs in 56 prostate tumor tissues compared with 21 normal prostate tissues. (B) Reverse transcription quantitative PCR indicated that miR-129-5p was decreased in 30 prostate cancer tissues in comparison with 30 matched normal prostate tissues. (C) In comparison with normal epithelial prostate cell line RWPE-1, expression of miR-129-5p was reduced in prostate cancer cell lines (PC-3, DU145, and LNCaP). *P<0.05, **P<0.01, ***P<0.001.
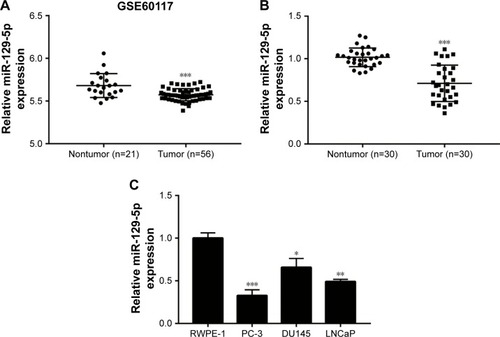
Figure 2 MiR-129-5p regulated cell proliferation in PC-3 and RWPE-1 cells.
Notes: (A) Transfection of miR-129-5p mimics elevated miR-129-5p expression by more than three-fold in PC-3 cells. (B) MiR-129-5p mimics inhibited cell proliferation of PC-3 cells in the CCK-8 assay. (C) In the colony forming assay, overexpression of miR-129-5p decreased colony number formed by PC-3 cells. (D) Quantitative analysis of colony number in (C). (E) Transfection of miR-129-5p antagonist decreased miR-129-5p expression in RWPE-1 cells. (F) Cell growth ability was elevated toward miR-129-5p downregulation in RWPE-1 cells. (G) MiR-129-5p antagonist increased colony number formed by RWPE-1 cells. (H) Quantitative analysis of colony number in (G). *P<0.05, **P<0.01, ***P<0.001.
Abbreviation: CCK-8, Cell Counting Kit-8.
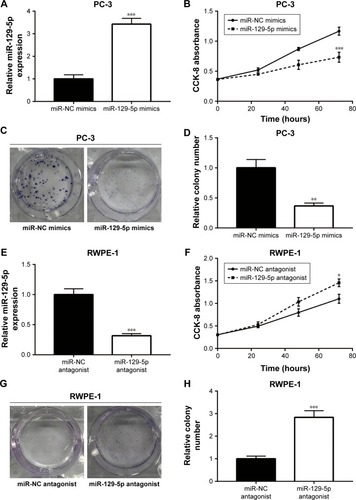
Figure 3 ETV1 was negatively regulated by miR-129-5p.
Notes: (A) In comparison with normal epithelial prostate cell line RWPE-1, expression of ETV1 mRNA was reduced in prostate cancer cell lines (PC-3, DU145, and LNCaP). (B) MiR-129-5p mimics decreased ETV1 mRNA expression in PC-3 cells. (C) MiR-129-5p mimics decreased ETV1 protein expression in PC-3 cells. (D) Quantitative analysis of ETV1 protein expression in (C). (E) MiR-129-5p antagonist increased ETV1 mRNA expression in RWPE-1 cells. (F) MiR-129-5p antagonist increased ETV1 protein expression in RWPE-1 cells. (G) Quantitative analysis of ETV1 protein expression in (F). *P<0.05, **P<0.01, ***P<0.001.
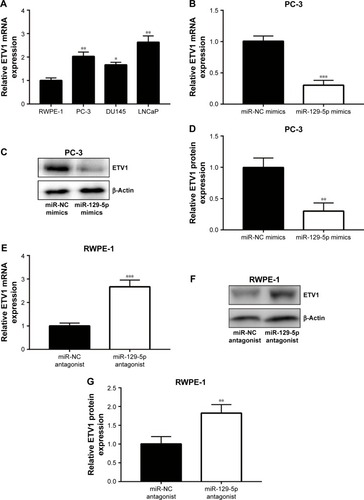
Figure 4 ETV1 was a direct target of miR-129-5p.
Notes: (A) Sequence alignment of ETV1 mRNA 3′UTR-WT (wild type), 3′UTR-Mut (mutant), and miR-129-5p sequence. (B) Dual Luciferase Reporter Assay showed that miR-129-5p mimics reduced luciferase activity of PC-3 cells transfected with pGL3-ETV1 3′UTR-WT not mutant ETV1 3′UTR. (C) Dual Luciferase Reporter Assay showed that miR-129-5p mimics reduced luciferase activity of RWPE-1 cells transfected with pGL3-ETV1 3′UTR-WT not mutant ETV1 3′UTR. **P<0.01.
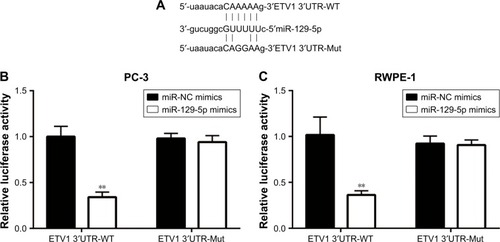
Figure 5 MiR-129-5p mimics repressed YAP and its target gene expression in PC-3 cells.
Notes: (A) MiR-129-5p overexpression decreased YAP mRNA level in PC-3 cells. (B) Western blot showed that YAP protein level was reduced toward miR-129-5p overexpression. (C) Quantitative analysis of YAP protein level in (B). (D) MiR-129-5p overexpression decreased CTGF and CYR61 mRNA levels in PC-3 cells. (E) Western blot showed that CTGF and CYR61 protein levels were reduced toward miR-129-5p overexpression. (F) Quantitative analysis of CTGF and CYR61 protein levels in (E). **P<0.01, ***P<0.001.
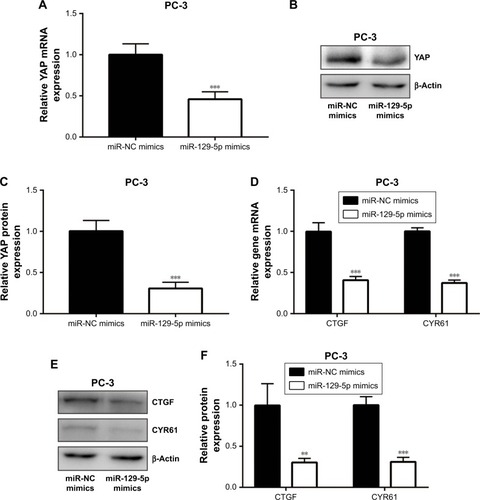
Figure 6 MiR-129-5p downregulation elevated YAP and its target gene expression in RWPE-1 cells.
Notes: (A) MiR-129-5p downregulation increased YAP mRNA level in RWPE-1 cells. (B) Western blot showed that YAP protein level was elevated toward miR-129-5p downregulation. (C) Quantitative analysis of YAP protein level in (B). (D) MiR-129-5p downregulation increased CTGF and CYR61 mRNA levels in RWPE-1 cells. (E) Western blot showed that CTGF and CYR61 protein levels were elevated toward miR-129-5p downregulation. (F) Quantitative analysis of CTGF and CYR61 protein levels in (E). *P<0.05, **P<0.01, ***P<0.001.
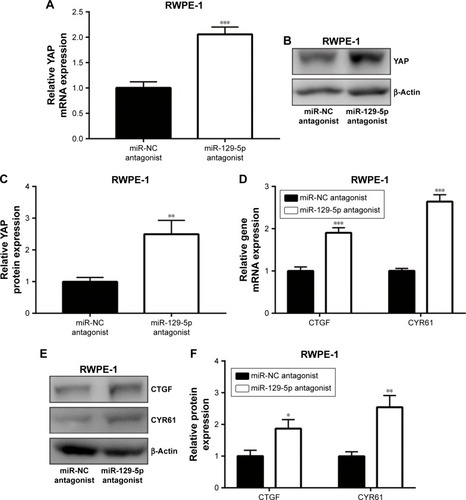
Figure 7 Forced elevation of ETV1 expression rescued cell growth arrest and inhibition of colony forming ability induced by miR-129-5p mimics in PC-3 cells.
Notes: (A) MiR-129-5p mimics decreased ETV1 protein level, which could be reversed by transfection of pcDNA3.1-ETV1. (B) Quantitative analysis of ETV1 protein level in (A). (C) Overexpression of ETV1 attenuated the suppression effect of miR-129-5p mimics on cell growth. (D) In a colony forming assay, ETV1 overexpression attenuated the decrease of colony number induced by miR-129-5p mimics. (E) Quantitative analysis of colony number in (D). *P<0.05, **P<0.01, ***P<0.001.
Abbreviation: CCK-8, Cell Counting Kit-8.
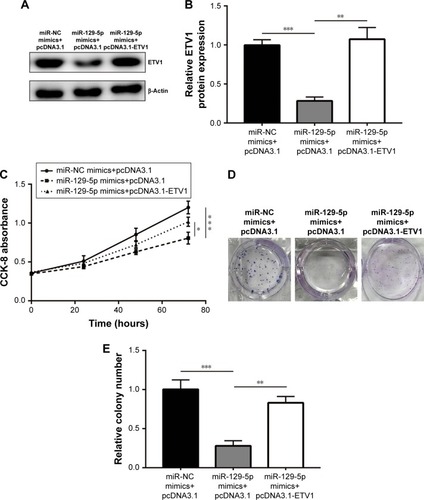
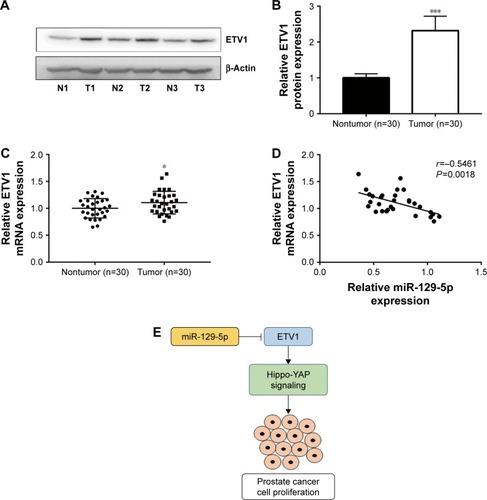
Figure 8 Expression of miR-129-5p was inversely associated with ETV1 mRNA levels in prostate cancer tissues.
Notes: (A) Representative Western blot of ETV1 expression in three pairs of prostate tumor tissues and matched normal tissues. (B) Quantification of ETV1 protein levels in prostate tumor tissues and matched normal tissues in (A). (C) Reverse transcription-quantitative PCR showed that ETV1 mRNA levels were significantly elevated in 30 prostate tumor tissues compared with adjacent normal prostate tissues. (D) Analysis of miR-129-5p expression and ETV mRNA levels showed a negative correlation between them. (E) Diagram of an miR-129-5p/ETV1/Hippo-YAP axis in prostate cancer cells. *P<0.05, ***P<0.001.