Figures & data
Table 1 Primers for qRT-PCR and sequences for CIC siRNA
Table 2 Correlation of miR-106b expression with clinic pathological characteristics of patients
Figure 1 Expression of miR-106b and CIC in RCC tissues and cell lines. Notes: (A) qRT-PCR analysis showed the expression of miR-106 in the RCC tissues (tumor) and the adjacent non-tumor tissues (normal) in patient samples (n=20). (B) qRT-PCR analysis of expression of miR-106b in RCC cancer cell lines (786–0, ACHN, Caki-1, Caki-2) and in normal renal tubules epithelium cell HK-2. (C) qRT-PCR analysis showed the expression of CIC in the RCC tissues (tumor) and the adjacent non-tumor tissues (normal) in patient samples (n=20). (D) qRT-PCR analysis of expression of CIC in RCC cancer cell lines (786–0, ACHN, Caki-1, Caki-2) and in normal renal tubules epithelium cell HK-2. **P<0.01, vs HK-2 cell; #P<0.05, vs 786-O cell.Abbreviations: CIC, capicua homology protein; RCC, renal call carvinoma cancer.
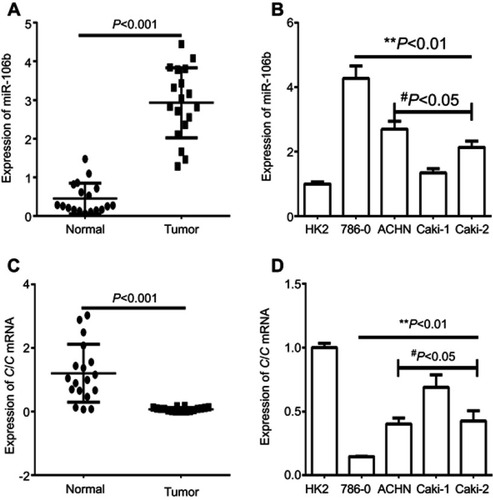
Figure 2 Ectopic expression of miR-106b promotes proliferation in RCC cells in vitro and in vivo. Notes: (A) miR-106b levels in 786-O cells transfected with scramble miRNA (miR-NC), miR-106b mimics, or miR-106b inhibitor. (B) CCK-8 assay of 786-O cells transfected with scramble miRNA, miR-106b mimics or miR-106b inhibitor. (C–D) Representative images and quantification of the BrdU cell proliferation assay (400×), *P<0.05, **P<0.01, vs mock group. (E) miR-106b silencing (anti-miR-106b) inhibits tumor growth in 786-O cells derived xenografts compared with negative control (NC). *P<0.05, vs NC.
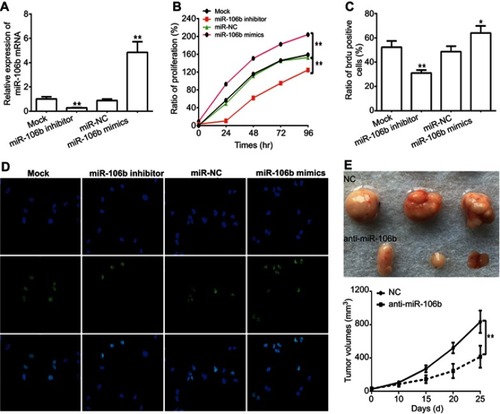
Figure 3 miR-106b promotes invasion of RCC cells in vitro. Notes: Representative images and quantification of 786-O invasive cells transfected without (Mock) or within scramble miRNA, miR-106b mimics, or miR-106b inhibitor (100×). The cell number of invasive cells were counted in randomly selected fields and presented in the bar graph (mean ± SD; *P<0.05, **P<0.01, vs mock group).
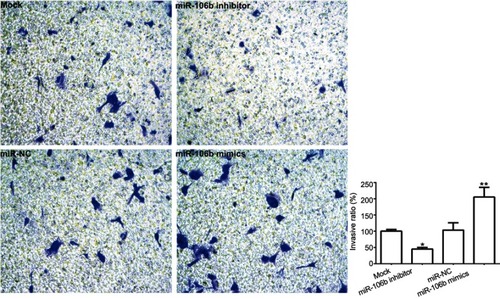
Figure 4 miR-106b promotes EMT progression of RCC cells in vitro. Notes: (A–D) mRNA levels of EMT-related proteins and CIC examined by qRT-PCR in 786-O cells transfected with miR-106b mimics, miR-106b inhibitor, or scramble miRNA. (E–I) protein levels of EMT-related proteins and CIC examined by qRT-PCR in 786-O cells transfected with miR-106b mimics, miR-106b inhibitor or scramble miRNA. **P<0.01, vs mock group.
Abbreviations: CIC, capicua hohology protein; EMT, epithelial-mesenchymal transition; NC, negative control.
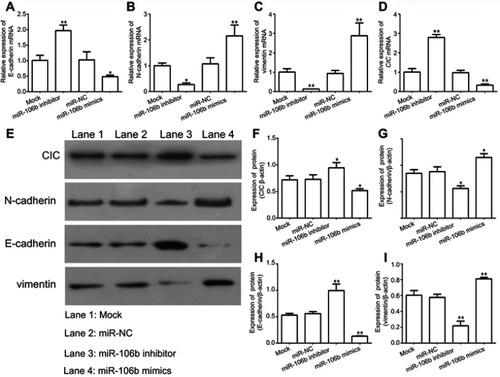
Figure 5 miR-106b directly targets the 3ʹ-UTR of CIC in renal carcinoma cancer. Notes: Luciferase activity of 786-O cells transfected with plasmids carrying a wild-type or mutant 3ʹ-UTR of CIC, in response to miR-106b mimics or miR-NC. **P<0.01, vs miR-NC group.
Abbreviations: CIC, capicua homology protein; NC, negative control.
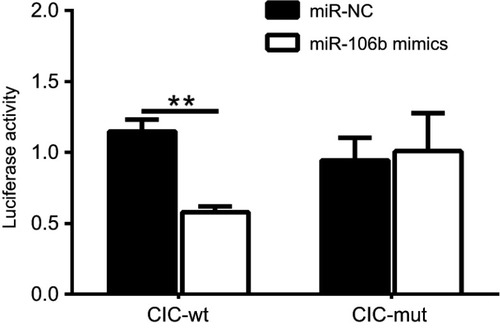
Figure 6 CIC inhibits cell proliferation, invasion in RCC cells. Notes: (A) mRNA levels of CIC in 786-O cells transfected with CIC silencing plasmid (CIC-shRNA), CIC overexpressed plasmid (pcDNA3.1-CIC) or negative controls (pcDNA3.1). (B) CCK-8 assay of 786-O cells transfected with indicated molecular. (C) Representative images and quantification of the BrdU cell proliferation assay (400×). (D) Representative images and quantification of 786-O invasive cells transfected with indicated molecular. *P<0.05, vs mock group; **P<0.01, vs mock group.
Abbreviations: CIC, capicua homology protein; RCC, renal cell carcinoma cancer.
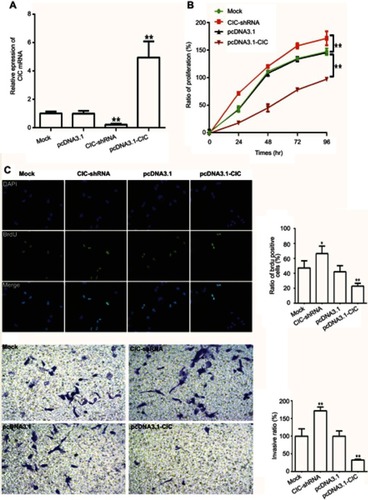
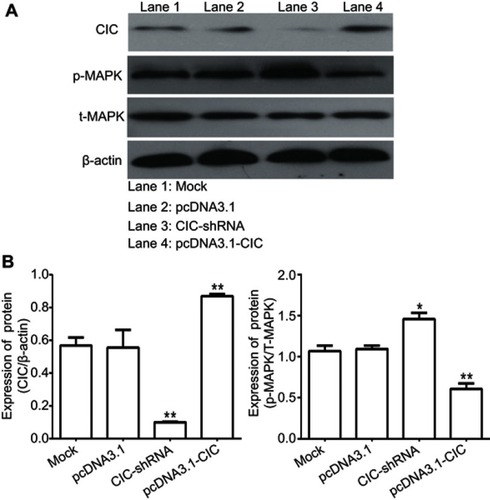
Figure 7 CIC inhibits activation of MAPK signaling pathway in vitro. Notes: Changes of phosphorylation levels of MAPK in 786-O cells transfected with indicated molecular. **P<0.01, vs mock group. Representative images (A) and quantification (B) of levels of CIC, phosphorylated MAPK and total MAPK in 786-O cells transfected with indicated molecular. The band density was qualified by Image J software, and β-actin was used as internal controls.
Abbreviation: CIC, capicua homology protein.