Figures & data
Figure 1 To investigate the expression of PD-L1 in NK/T cell lines, we detected the protein level in Flow cytometer and Western blot.
Notes: (A) NK cells were enriched by magnetic separation. The purity of the enriched NK cell analyzed in flow cytometer was above 85%. (B) The PD-L1 expression in normal NK cells and different NK/T cell lines is shown. This experiment was done three times (P<0.05). (C) The PD-L1 expression in normal NK cells and different NK/T cell lines in Western blot is shown. (D) PD-L1 protein expression was analyzed by Image studio lite software and absolute quantity was graphed.
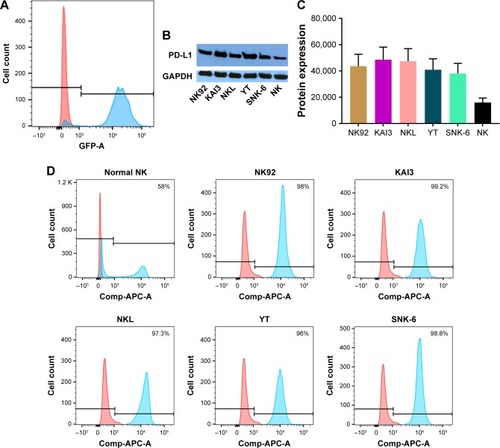
Figure 2 Anti-PD-L1 treatment induces a durable antitumor effect.
Notes: (A) Tumor challenge and treatment experimental design. (B) After 4 weeks of treatment, when the control group had two mice left and the treatment group four left, the study was terminated. The overall survival of mice was graphed (P<0.05). (C) The median survival was calculated (P<0.05).
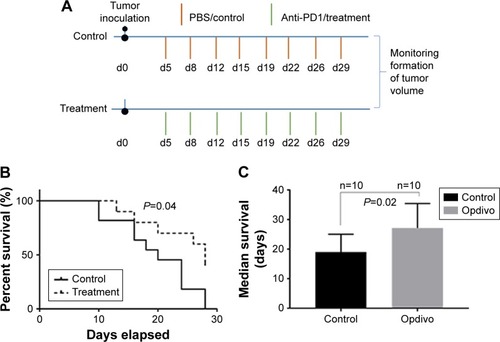
Figure 3 Anti-PD-1 treatment significantly increases the amount of tumor-infiltrating T cell and ratios of both CD4 and CD8 T cells to Treg cells and MDSC.
Notes: (A–D) The effect of anti-PD1 on tumor-infiltrating cell harvested from treated mice was analyzed at the end of the experiment. (E–H) These contrasting changes in effector and immunosuppressive cells gave rise to the significantly elevated ratios of both effector CD4+ and CD8+ T cells to Treg cells and MDSC in tumor-infiltrating cell of mice receiving combined anti-PD1 treatment.
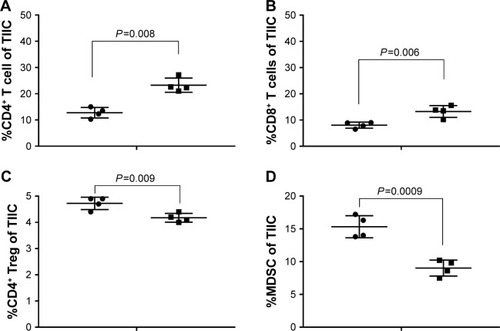
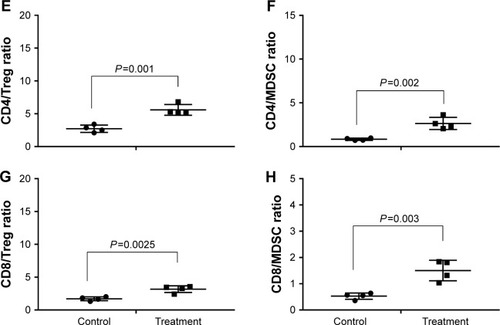
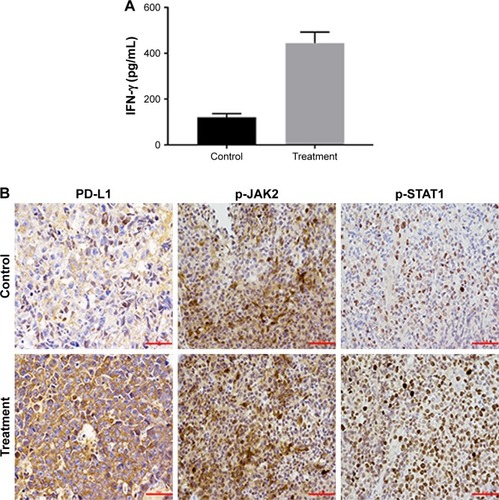
Figure 4 In vivo anti-PD1 treatment induced PD-L1 expression through IFN-γ associated with JAK-STAT pathway in EL4 tumors.
Notes: (A) IFN-γ concentration is higher in treatment group than the control (120 vs 444.1 pg/mL, P<0.05). (B) PD-L1, p-JAK2, p-STAT1 protein expression in IHC was evaluated. Scale bar 50 μm; magnification ×400.