Figures & data
Table 1 Patient characteristics
Table 2 Treatment efficacy in patients with and without HTN
Figure 1 Overall survival and progression-free survival by hypertension during apatinib treatment.
Notes: (A) PFS was compared between the two groups. (B) OS was compared between the two groups.
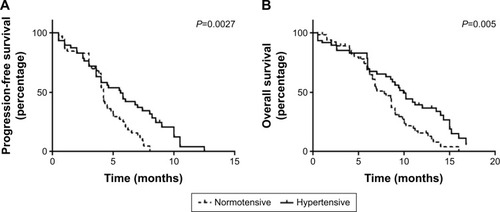
Table 3 Progression-free survival in univariate and multivariate analyses
Table 4 Overall survival in univariate and multivariate analyses
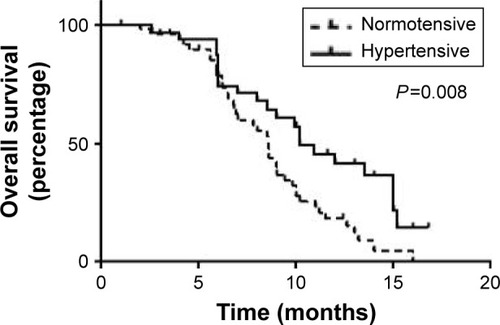
Figure 2 Landmark analysis of overall survival in patients with and without hypertension with landmark at 2 months.