Figures & data
Table 1 Sequences of qRT-PCR primers used for mRNA analysis
Table 2 Antibody list
Table 3 Correlation between CENPK expression and clinico-pathological characteristics of HCC patients in TCGA database
Figure 1 CENPK is upregulated in HCC tissues.
Notes: (A) Expression of CENPK in TCGA database (n=50). (B) Overall survival of HCC patients with high/low CENPK expression in TCGA database (P=0.008). (C) mRNA levels of CENPK in HCC tissues and ANLTs were detected by qRT-PCR (n=30). (D) Protein levels of CENPK in HCC tissues and ANLTs were detected by Western blotting (n=8). N represents ANLTs; T represents HCC tissues.
Abbreviations: HCC, hepatocellular carcinoma; ANLTs, adjacent non-tumor tissues; qRT-PCR, quantitative real-time PCR; TCGA, the Cancer Genome Atlas.
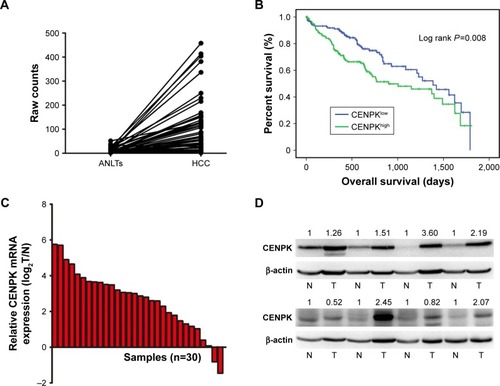
Figure 2 Silencing of CENPK inhibits HCC cell growth, migration, and invasion in vitro.
Notes: (A) Expression of CENPK in BEL-7404 and SMMC-7721 cells was confirmed by qRT-PCR and Western blotting after transfection with shCENPK lentivirus or shNC. (B) Proliferation rate of BEL-7404 and SMMC-7721 cells was measured over 4 days by the CCK-8 assay. (C and D) Representative images (C) and quantification (D) of the colony formation assays are shown for BEL-7404 and SMMC-7721 cells. (E) Analysis of migration in BEL-7404 and SMMC-7721 cells as measured by wound healing assays (×200). (F and G) Analysis of invasion in BEL-7404 and SMMC-7721 cells as measured by transwell assays. (F) Representative photographs (×200). (G) Number of invaded cells was counted in five randomly selected areas. Scale bar =100 µm. NC represents negative control group (shNC), and shCENPK represents downregulation of CENPK group. *P<0.05, **P<0.01, ***P<0.001.
Abbreviations: qRT-PCR, quantitative real-time PCR; CCK-8, Cell Counting Kit-8; NC, negative control.
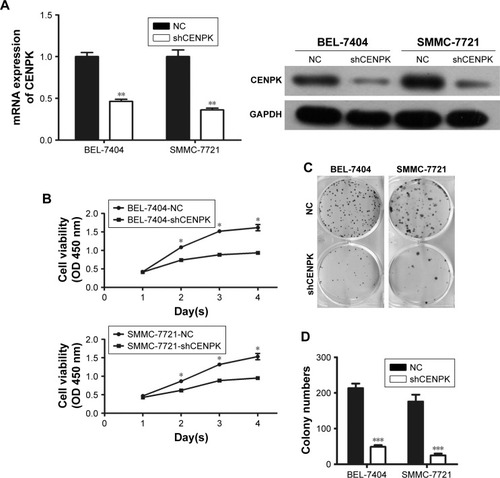
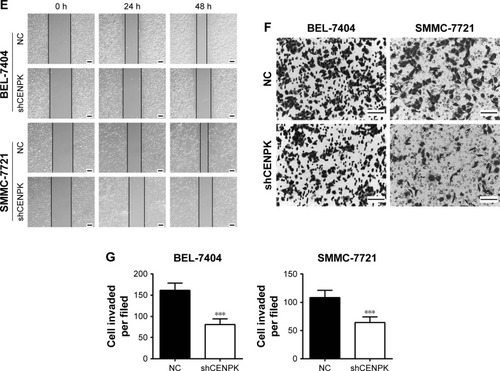
Figure 3 Silencing of CENPK suppresses HCC tumor growth in vivo.
Notes: (A) Representative bioluminescence images (n=10). (B) Fluorescence intensity of GFP was weaker in the BEL-7404-shCENPK group than in the BEL-7404-shNC group. (C) Transduced BEL-7404 cells were subcutaneously injected into nude mice (n=10). (D and E) After 24 days, the mice were euthanized, and the tumors were excised. Representative tumors are shown: (D) tumor growth curve and (E) tumor weight. ***P<0.001.
Abbreviations: HCC, hepatocellular carcinoma; GFP, green fluorescent protein; NC, negative control.
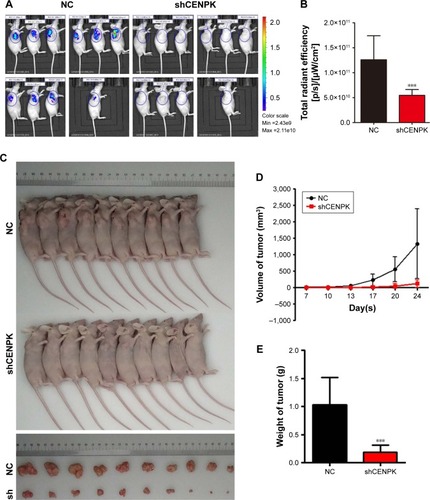
Figure 4 Silencing of CENPK induces differential expression of genes involved in malignant solid tumour, cell proliferation, and invasion.
Notes: (A) Disease function enrichment of mRNAs in CENPK knockdown BEL-7404 cells was analyzed by using IPA. (B) Predicted activation state of each disease function based on the regulation z-score is shown (when z-score ≤ −2, IPA predicts that the process or disease will decrease). (C) Gene interaction network indicating a cluster of genes regulated by transcription factors YAP1.
Abbreviation: IPA, Ingenuity Pathway Analysis.
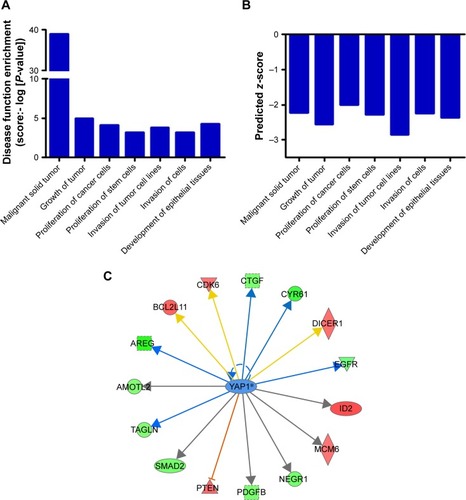
Figure 5 Modulation of CENPK expression regulates YAP1 signaling pathway in HCC cells.
Notes: (A) The mRNA expression of CENPK, YAP1, NUPR1, RELB, TEAD, CTGF, and CYR61 was evaluated by qRT-PCR in HCC cells. *P<0.05. (B) The protein expression of CENPK, YAP1, and CYR61 was detected by Western blotting. (C) Immunofluorescence images of YAP1 (red) and DAPI (blue) in HCC cells (×400).
Abbreviations: HCC, hepatocellular carcinoma; qRT-PCR, quantitative real-time PCR; NC, negative control.
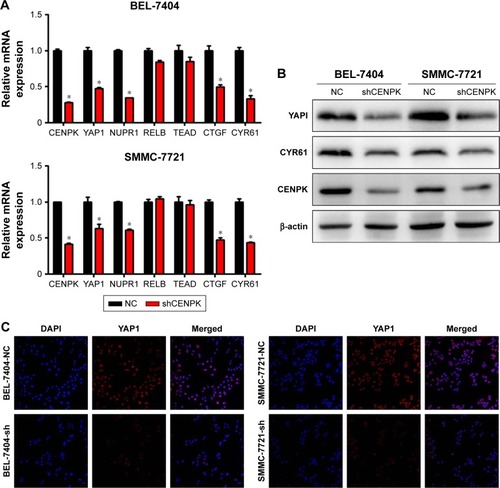
Figure 6 Silencing of YAP1 partially mimics the tumor-suppressive effects of CENPK knockdown in HCC cells.
Notes: (A) YAP1 and CYR61 expression was detected by Western blotting. (B–G) YAP1 knockdown inhibited HCC cell proliferation, colony formation, migration, and invasion as demonstrated by the (B and C) colony formation assay, (D) CCK-8 assay, (E) wound healing assay, and (F and G) transwell assay. Scale bar =100 µm. *P<0.05, **P<0.01, ***P<0.001.
Abbreviations: HCC, hepatocellular carcinoma; CCK-8, Cell Counting Kit-8; NC, negative control.
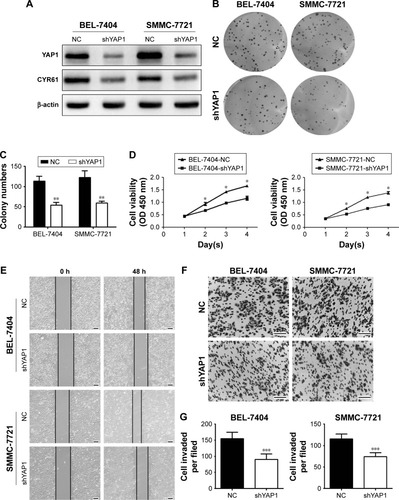
Figure 7 YAP1 modulates the effects of CENPK on HCC cell proliferation, migration, and invasion.
Notes: (A) YAP1 and CYR61 expression in SMMC-7721 cells was detected by Western blotting. (B–E) Restoration of YAP1 partially rescued the inhibitory effect on proliferation, colony formation, migration, and invasion in CENPK knockdown SMMC-7721 cells as determined by the (B) CCK-8 assay, (C) colony formation assay, (D) wound healing assay, and (E) transwell assay. Scale bar =100 µm. sh represents shCENPK group; sh + nc represents shCENPK + pcDNA3.1-YAP1-NC plasmid group; sh + YAP1 represents shCENPK + pcDNA3.1-YAP1 plasmid group. The Yap1 signaling pathway modulates the effects of CENPK on HCCEMT progress. **P<0.01, ***P<0.001.
Abbreviations: HCC, hepatocellular carcinoma; CCK-8, Cell Counting Kit-8; NC, negative control.
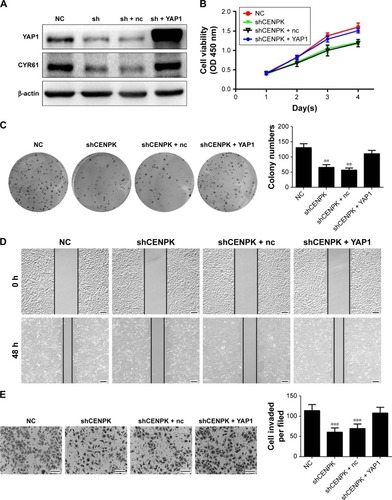
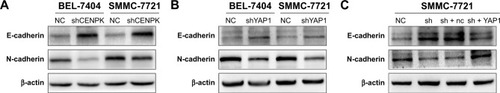
Figure 8 The YAP1 signaling pathway modulates the effects of CENPK on HCC EMT progress.
Notes: (A) Expression of E-cadherin and N-cadherin in BEL-7404 and SMMC-7721 cells was determined by Western blotting after transfection with shCENPK lentivirus or shNC. (B) Expression of E-cadherin and N-cadherin in BEL-7404 and SMMC-7721 cells was detected by Western blotting after transfection with shYAP1 lentivirus or shNC. (C) Expression of E-cadherin and N-cadherin was examined by Western blotting in NC, shCENPK, shCENPK + nc, and shCENPK + YAP1 groups.
Abbreviations: HCC, hepatocellular carcinoma; EMT, epithelial–mesenchymal transition; NC, negative control.