Figures & data
Figure 1 Metabolism of S-1.
Abbreviations: 5-FU, 5-fluorouracil; CDHP, gimeracil; CYP2A6, cytochrome P450 2A6; DPD, dihydropyrimidine dehydrogenase; FUH2, 5-fluorodihydrouracil; FUMP, fluorouridine monophosphate; OPRT, orotate phosphoribosyltransferase; Oxo, oteracil potassium.
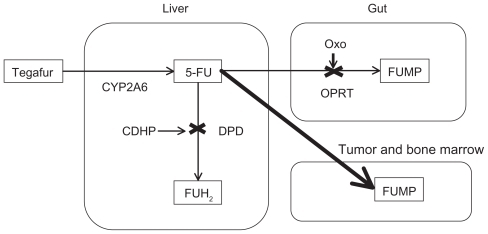
Figure 2 Metabolism of capecitabine.
Abbreviations: CE, carboxylesterase; 5′-DFCR, 5′-deoxyfluorocytidine, 5′-DFUR, doxifluridine; 5-FU, 5-fluorouracil; CD, cytidine deaminase; TP, thymidine phosphorylase.
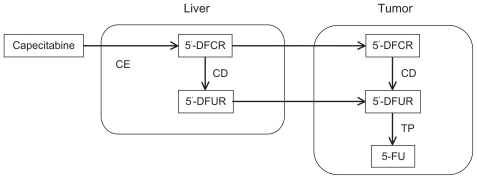
Table 1 The optimal dose of S-1-based chemotherapy
Table 2 Adverse events of First-line Advanced Gastric Cancer Study trial
Table 3 Results of Phase II trials of S-1-based chemotherapy