Figures & data
Figure 1 Luteolin inhibited cell proliferation in glioma cells.
Notes: (A) The molecular structural formula of luteolin. (B) LN229 cells were incubated with different concentrations of luteolin for 24 and 48 hours, and then the cell viability was measured by CCK-8 assay. (C) U251 cells were incubated with different concentrations of luteolin for 24 and 48 hours, and then the cell viability was measured by CCK-8 assay. (D) HEB cells were incubated with different concentrations of luteolin for 24 and 48 hours, and then the cell viability was measured by CCK-8 assay. (E) LN229, U251, and HEB cell lines were incubated with luteolin and temozolomide, respectively, for 24 hours. Data are expressed as the mean ± SD of three independent experiments (**P<0.01, ***P<0.001 vs the control group; n=3).
Abbreviations: CCK-8, Cell Counting Kit-8; TMZ, temozolomide.
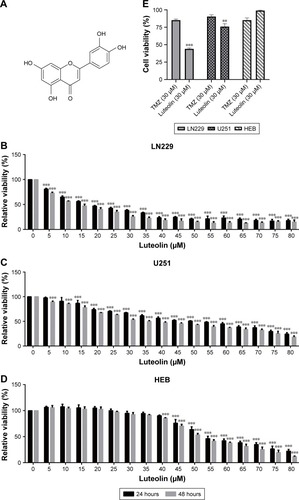
Figure 2 Luteolin induced apoptosis.
Notes: (A) LN229 cells were exposed to luteolin at different concentrations (0, 10, 20, and 30 µM) for 24 hours then stained with Hoechst 33258. The nuclei were observed under a fluorescence microscope. The white arrows indicate the apoptosis bodies in glioma cells. (B) LN229 cells were stained with Annexin V-FITC/PI and measured by flow cytometry. Statistical analysis was performed for apoptosis assay (***P<0.001 vs the control group; n=3). (C) U251 cells were exposed to luteolin at different concentrations (0, 10, 20, and 30 µM) for 24 hours then stained with Hoechst 33258. The nuclei were observed under a fluorescence microscope. The white arrows indicate the apoptosis bodies in glioma cells. (D) U251 cells were stained with Annexin V-FITC/PI and measured by flow cytometry. Statistical analysis was performed for apoptosis assay (**P<0.01, ***P<0.001 vs the control group; n=3).
Abbreviations: FITC, fluorescein isothiocyanate; PI, propidium iodide.
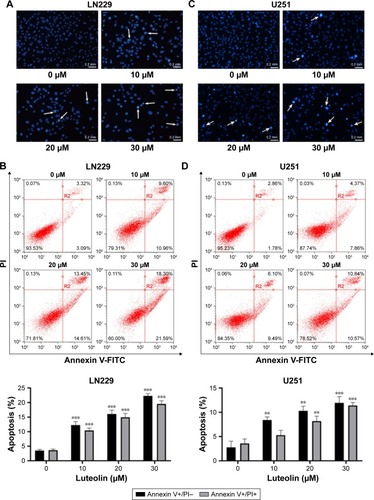
Figure 3 Luteolin activated the death receptor pathway.
Notes: (A) LN229 cells were exposed to luteolin (0, 10, 20, and 30 µM) for 24 hours; the levels of FADD, PARP, and cleaved PARP were then measured by Western blot analysis. (B) The expression levels of FADD in luteolin-treated LN229 cells are shown as histograms. (C) The expression levels of PARP and cleaved PARP in luteolin-treated LN229 cells are shown as histograms. (D) LN229 cells were exposed to luteolin (0, 10, 20, and 30 µM) for 24 hours; the levels of Caspase-8, cleaved Caspase-8, Caspase-3, and cleaved Caspase-3 were measured by Western blot analysis. (E) The expression levels of Caspase-3 and cleaved Caspase-3 in luteolin-treated LN229 cells are shown as histograms. (F) The expression levels of Caspase-8 and cleaved Caspase-8 in luteolin-treated LN229 cells are shown as histograms. (G) U251 cells were exposed to luteolin (0, 10, 20, and 30 µM) for 24 hours; the levels of FADD, Caspase-8, cleaved Caspase-8, Caspase-3, cleaved Caspase-3, PARP, and cleaved PARP were then measured by Western blot analysis. (H) The expression levels of FADD in luteolin-treated U251 cells are shown as histograms. (I) The expression levels of PARP and cleaved PARP in luteolin-treated U251 cells are shown as histograms. (J) The expression levels of Caspase-3 and cleaved Caspase-3 in luteolin-treated U251 cells are shown as histograms. (K) The expression levels of Caspase-8 and cleaved Caspase-8 in luteolin-treated U251 cells are shown as histograms. (*P<0.05, **P<0.01, ***P<0.001 vs the control group; n=3).
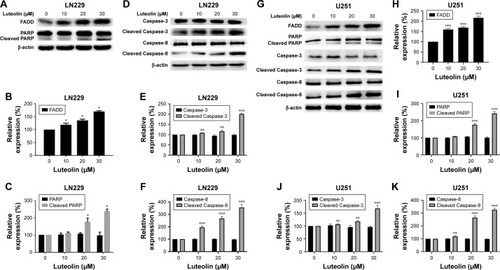
Figure 4 Luteolin activated the MAPK signaling pathway.
Notes: (A) LN229 cells were treated with luteolin (0, 10, 20, and 30 µM) for 24 hours, and Western blot analysis was performed to measure the expression levels of ERK, P-ERK, JNK, P-JNK, p38, P-p38, Bax, and Bcl-2. (B) The expression levels of ERK and P-ERK in luteolin-treated LN229 cells are shown as histograms. (C) The expression levels of JNK and P-JNK in luteolin-treated LN229 cells are shown as histograms. (D) The expression levels of p38 and P-p38 in luteolin-treated LN229 cells are shown as histograms. (E) The ratio of Bax to Bcl-2 in luteolin-treated LN229 cells is shown as a histogram. (F) U251 cells were treated with luteolin (0, 10, 20, and 30 µM) for 24 hours, and Western blot analysis was performed to measure the levels of ERK, P-ERK, JNK, P-JNK, p38, P-p38, Bax, and Bcl-2. (G) The expression levels of ERK and P-ERK in luteolin-treated U251 cells are shown as histograms. (H) The expression levels of JNK and P-JNK in luteolin-treated U251 cells are shown as histograms. (I) The expression levels of p38 and P-p38 in luteolin-treated U251 cells are shown as histograms. (J) The ratio of Bax to Bcl-2 in luteolin-treated U251 cells is shown as a histogram. (*P<0.05, **P<0.01, ***P<0.001 vs the control group; n=3).
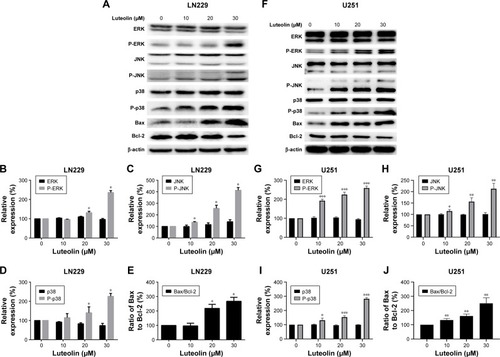
Figure 5 Luteolin promoted the expression of miR-124-3p and induced autophagy in glioma cells cells.
Notes: (A) The expression levels of LC3B I, LC3B II, and p62 were evaluated by Western blot analysis in luteolin-treated LN229 cells. (B) The ratio of LC3B II to LC3B I in luteolin-treated LN229 cells is shown as a histogram. (C) Relative expression of p62 in luteolin-treated LN229 cells is shown in the diagram. (D) The expression levels of LC3B I, LC3B II and p62 were evaluated by Western blot analysis in luteolin-treated U251 cells. (E) The ratio of LC3B II to LC3B I in luteolin-treated U251 cells is shown as a histogram. (F) Relative expression of p62 in luteolin-treated U251 cells is shown in the diagram. (G) The expression levels of LC3B I, LC3B II, and p62 were evaluated by Western blot analysis in LN229 cells treated with luteolin (30 µM), or luteolin (30 µM)+3-MA (1 mM). L: Luteolin. (H) The ratio of LC3B II to LC3B I in LN229 cells is shown as a histogram. (I) Relative expression of p62 in LN229 cells is shown in the diagram. (J) The expression levels of LC3B I, LC3B II, and p62 were evaluated by Western blot analysis in U251 cells treated with luteolin (30 µM), or Luteolin (30 µM)+3-MA (1 mM). L: Luteolin. (K) The ratio of LC3B II to LC3B I in U251 cells is shown as a histogram. (L) Relative expression of p62 in U251 cells is shown in the diagram. (M) The expression levels of miR-124-3p in luteolin-treated LN229 cells are shown as histograms. (N) The expression levels of miR-124-3p in luteolin-treated U251 cells are shown as histograms. (O) Effects of luteolin, luteolin + miR-124-3p mimics, and luteolin + miR-124-3p inhibitor on LN229 cells’ viability. (P) Effects of luteolin, luteolin + miR-124-3p mimics, and luteolin + miR-124-3p inhibitor on U251 cells’ viability. (Q) Western blot analysis of the expression of Caspase-3 and cleaved Caspase-3 under different treatment conditions in LN229 cells: L +124M, luteolin + miR-124-3p mimics; L +124 I, luteolin + miR-124-3p inhibitor. (R) Western blot analysis of the expression of Caspase-3 and cleaved Caspase-3 under different treatment conditions in U251 cells: L +124M, luteolin + miR-124-3p mimics; L +124 I, luteolin + miR-124-3p inhibitor. (*P<0.05, **P<0.01, ***P<0.001 vs the control group; n=3).
Abbreviation: 3-MA, 3-methyadenine.
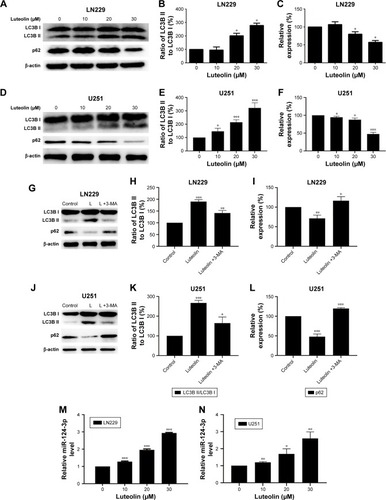
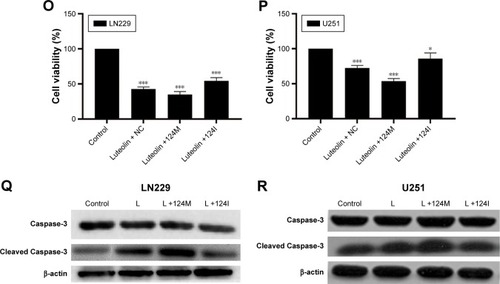
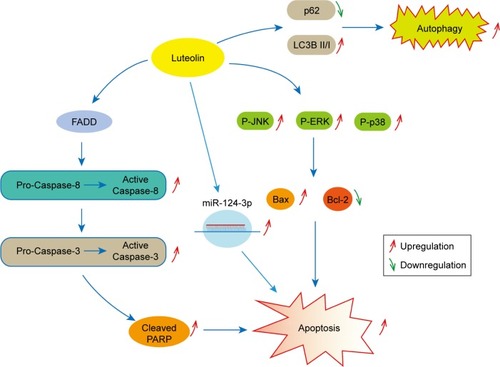
Figure 6 Experimental mechanism diagram.
Note: Luteolin suppresses tumor proliferation through inducing apoptosis and autophagy via MAPK activation in glioma.