
Figures & data
Figure 1 Increase of STC2 expression in GEO and TCGA databases in CRC.
Notes: (A) DEGs in CRC vs normal tissues across each independent dataset. Each column represents a sample and each row represents the expression level of a given mRNA. The color scale represents the raw Z score ranging from blue (low expression) to red (high expression). (B) Venn diagrams of overlapping DEGs between GSE21510, GSE32323, GSE39582, and GSE41328. (C) Analysis of STC2 expression in unpaired CRC (N=349) and normal tissues (N=41) in TCGA (P<0.001). (D) Analysis of STC2 expression in CRC and PANT (N=41) in TCGA (P<0.001). (E) High STC2 expression was associated with poor OS in CRC patients in TCGA.
Abbreviations: CRC, colorectal cancer; DEGs, differently expressed genes; GEO, Gene Expression Omnibus; OS, overall survival; PANT, paired adjacent normal tissues; STC2, stanniocalcin 2; TCGA, The Cancer Genome Atlas.
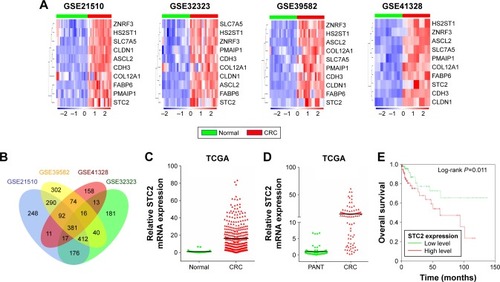
Figure 2 High expression of STC2 validated by our own database in CRC.
Notes: (A) DEGs in six pairs of CRC and PANT. (B) STC2 protein and mRNA levels were measured in CRC and PANT by Western blotting and qRT-PCR, respectively.
Abbreviations: CRC, colorectal cancer; DEGs, differently expressed genes; PANT, paired adjacent normal tissues; qRT-PCR, quantitative real-time polymerase chain reaction; STC2, stanniocalcin 2.
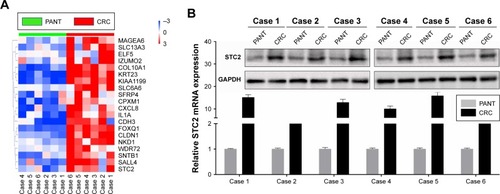
Table 1 Univariate and multivariate analyses of clinicopathological characteristics and STC2 with overall survival in TCGA
Figure 3 Detection of STC2 protein expression in tissues by IHC staining, and high STC2 expression in tumors predicted poor prognosis in CRC patients.
Notes: (A) Representative images of STC2 protein expression in CRC and PANT. STC2 protein expression was significantly increased in tumor specimens compared with PANT. (B) IHC staining of STC2 protein in CRC tissues. The staining intensity was scored as 0 (negative), 1 (weak positive), 2 (moderated positive), and 3 (strong positive). (C) High expression of STC2 had a worse OS for CRC patients.
Abbreviations: CRC, colorectal cancer; IHC, immunohistochemistry; OS, overall survival; PANT, paired adjacent normal tissues; STC2, stanniocalcin 2.
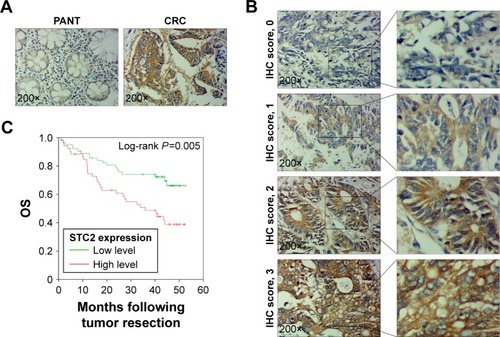
Table 2 Correlations between STC2 expression level and clinicopathological variables of 115 CRC patients
Table 3 Univariate and multivariate analyses of clinicopathological characteristics and STC2 with overall survival in 115 CRC patients
Figure S1 Differentially expressed genes in CRC vs normal tissues across each independent dataset. Each column represents a sample and each row represents the expression level of a given mRNA. The color scale represents the raw Z score ranging from blue (low expression) to red (high expression).
Abbreviation: CRC, colorectal cancer.
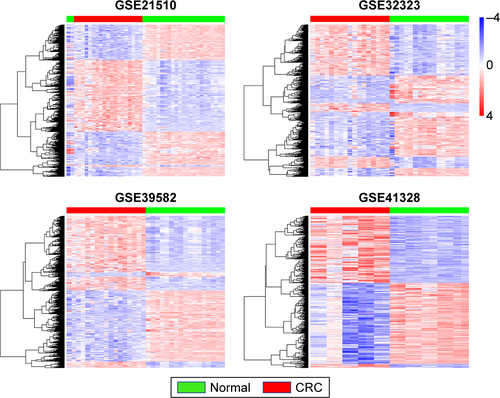
Table S1 Microarray datasets of mRNA expression profiles