Figures & data
Table 1 The clinicopathologic variables identified in 86 ovarian cancer patients
Figure 1 ZNF277 expression was upregulated in ovarian cancer (OC) tissues and cell lines. (A) The Human Protein Atlas database was used to detect the expression of ZNF277 in OC tissues and normal ovary tissues. (B) TCGA database was used to detect the survival times of patients with high ZNF277 expression and those with low ZNF277 expression, and Kaplan–Meier curves were drawn. (C) RT-qPCR was used to reveal the expression of ZNF277 in OC tissues and tumor-adjacent normal tissues, and the reference protein GAPDH was used as a negative control (n=3). Data are presented as the mean ± SD of three independent experiments (n=3; *P<0.05 vs tumor-adjacent normal tissues). (D) RT-qPCR was used to reveal the expression of ZNF277 in the OC cell lines SKOV3, OVCAR3, CAOV3, and A2780 compared to the human ovarian surface epithelial cells (HOSEPiCs). Results are presented as the mean ± standard error of three independent experiments (*P<0.05, **P<0.01 vs HOSEPiCs).
Abbreviations: TCGA, The Cancer Genome Atlas; RT-qPCR, quantitative reverse-transcription PCR.
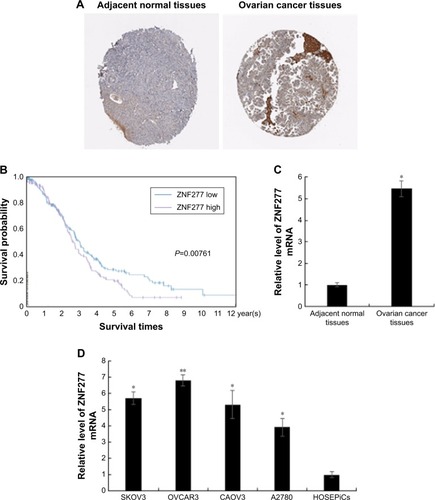
Figure 2 ZNF277 facilitated the proliferation ability of OC cells. (A) RT-qPCR was used to analyze the mRNA expression levels of ZNF277 after exposure to the ZNF277 plasmid or ZNF277-specific siRNA in SKOV3 and OVCAR3 cells (B). (C) ZNF277 affected the growth rate of OC cells. Cell growth viability was assayed in SKOV3 and OVCAR3 cells (D) transfected with vector, ZNF277 plasmid, NC, and siZNF277 using CCK-8 at 0, 24, 48, 72, and 96 hours time points. (E) ZNF277 facilitated the colony formation of OC cells. Colony formation was performed in stably overexpressing ZNF277 and in ZNF277 knockdown SKOV3 and OVCAR3 cells (F). Results are presented as mean ± SD, and error bars represent the mean ± SD of three independent experiments. *P<0.05, **P<0.01 as compared with the control group.
Abbreviations: OC, ovarian cancer; RT-qPCR, quantitative reverse-transcription PCR; NC, negative control; CCK-8, Cell Counting Kit-8.
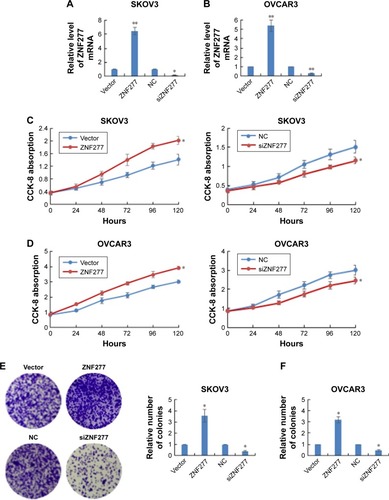
Figure 3 ZNF277 promoted migration and invasion in OC cells. (A) ZNF277 promoted migration in OC cells. Wound healing assay was performed in SKOV3 and OVCAR3 cells (B) following transfection with vector, ZNF277 plasmid, NC, and siZNF277. Analysis of the wound closure rate is shown, and data are presented as the mean ± SD of at least three independent experiments. (C) ZNF277 promoted invasion in OC cells. Transwell assays were used to measure the effect of ZNF277 on cell invasion in SKOV3 and OVCAR3 cells (D) transfected with vector, ZNF277 plasmid, NC, and siZNF277. Representative images of the invasion assays are shown. The data are presented as mean ± SD of three independent experiments. *P<0.05 as compared with the control group.
Abbreviations: OC, ovarian cancer; NC, negative control.
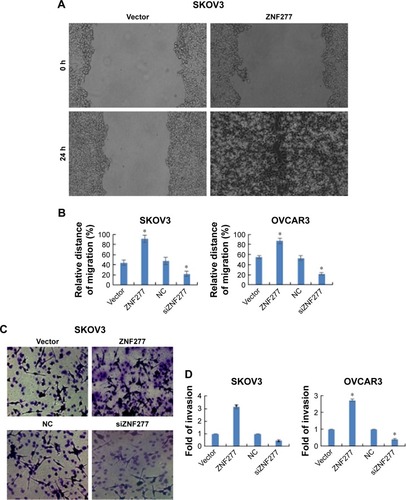
Figure 4 PTEN was a direct downstream target of ZNF277 in OC cells. (A) The binding of ZNF277 to the promoter of PTEN. qChIP was performed in SKOV3 and OVCAR3 cells to identify key target genes for ZNF277, such as P53, PTEN, CDH1, and P21. Normal IgG was used as a negative control (**P<0.01 as compared with the normal IgG). (B) Luciferase reporter activities driven by wild-type PTEN promoter were examined in SKOV3 or OVCAR3 cells transfected with Vector or ZNF277. (C) Luciferase reporter activities driven by wild-type PTEN promoter were examined in SKOV3 or OVCAR3 cells transfected with NC or siZNF277. Error bars indicate mean ± SD of three independent experiments (*P<0.05 vs Vector). (D) Luciferase reporter activities driven by mutant (Mut)-type PTEN promoter were examined in SKOV3 or OVCAR3 cells transfected with vector or ZNF277, NC or siZNF277. (E) Vector or ZNF277 was transfected into SKOV3 and OVCAR3 cells, and then the expression levels of PTEN were monitored using RT-qPCR and Western blot. The experiment was performed in triplicate and subsequently subjected to statistical analysis. (F) NC or siZNF277 was transfected into SKOV3 and OVCAR3 cells, and then the expression levels of PTEN were monitored using RT-qPCR and Western blot. Error bars indicate mean ± SD of three independent experiments (*P<0.05, **P<0.01 vs NC).
Abbreviations: OC, ovarian cancer; RT-qPCR, quantitative reverse-transcription PCR; qChIP, quantitative chromatin immunoprecipitation; NC, negative control; WT, wild type; Mut, mutant type.
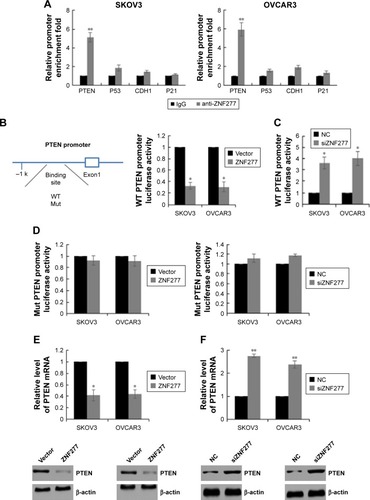
Figure 5 ZNF277 promoted OC cell proliferation by targeting PTEN. (A) The mRNA expression of PTEN was determined by RT-qPCR in SKOV3 and OVCAR3 cells transfected with PTEN overexpression plasmid. Error bars indicate mean ± SD of three independent experiments (**P<0.05 vs vector). (B) Cell viability of SKOV3 cells and (C) OVCAR3 cells transfected with vector, PTEN, ZNF217, and ZNF217+PTEN was determined by CCK-8 assay. Error bars represent mean ± SD of three independent experiments (*P<0.05 vs vector). (D) Cell growth of SKOV3 cells and (E) OVCAR3 cells transfected with vector, PTEN, ZNF217, and ZNF217+PTEN was determined by colony formation assay. Error bars represent mean ± SD of three independent experiments. *P<0.05 vs vector.
Abbreviations: OC, ovarian cancer; RT-qPCR, quantitative reverse-transcription PCR; CCK-8, Cell Counting Kit-8.
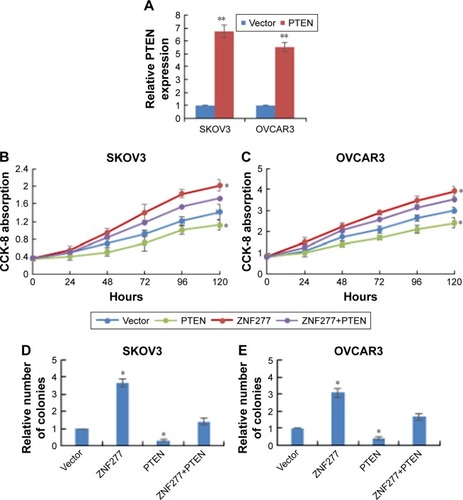
Figure 6 ZNF277 regulated OC cell migration and invasion through PTEN. (A) ZNF277 regulated OC cell (SKOV3) migration through PTEN (*P<0.05 vs vector). (B) OVCAR3 cells were transfected with vector, PTEN, ZNF217, and ZNF217+PTEN, respectively, and wound healing assay was performed; error bars represent the mean ± SD of three independent experiments (*P<0.05 vs vector). (C) ZNF277 regulated OC cell (SKOV3) invasion through PTEN (*P<0.05 vs vector). (D) OVCAR3 cells were transfected with vector, PTEN, ZNF217, and ZNF217+PTEN, respectively, and transwell assay was performed accordingly. Error bars represent mean ± SD of three independent experiments (*P<0.05 vs vector).
Abbreviation: OC, ovarian cancer.
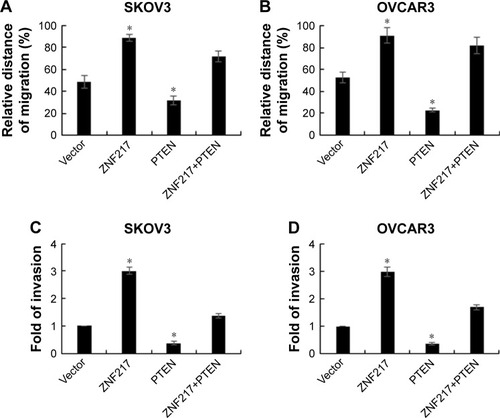
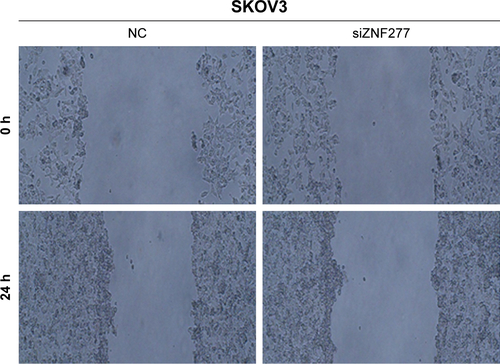
Figure S1 ZNF277 promoted migration in OC cells. Wound healing assay was performed in SKOV3 cells following transfection with NC and siZNF277. Pictures of the wound closure rate are shown.
Abbreviations: OC, ovarian cancer; NC, negative control.