Figures & data
Table 1 Clinicopathological characteristics of patient samples and expression of lncRNA SNHG20 in glioma
Figure 1 The lncRNA SNHG20 expression levels in glioma tissues are outstandingly higher than those in normal brain tissues.
Note: *P<0.05 means vs normal brain tissues.
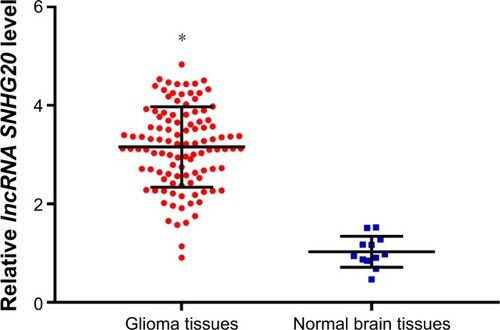
Table 2 Association between lncRNA SNHG20 expression and clinicopathological characteristics of glioma patients
Table 3 Spearman analysis of correlation between lncRNA SNHG20 and clinicopathological
Figure 2 Kaplan–Meier curves showing the survival of glioma patients with different lncRNA SNHG20 expression levels.
Notes: (A–E) OS curves stratified by lncRNA SNHG20 expression in total (A), low-grade (B), high-grade (C), small tumor size (D) and lager tumor size (E) glioma patients. (F–J) RFS curves stratified by lncRNA SNHG20 expression in total (F), low-grade (G), high-grade (H), small tumor size (I) and lager tumor size (J) glioma patients.
Abbreviations: OS, overall survival; RFS, recurrence-free survival.
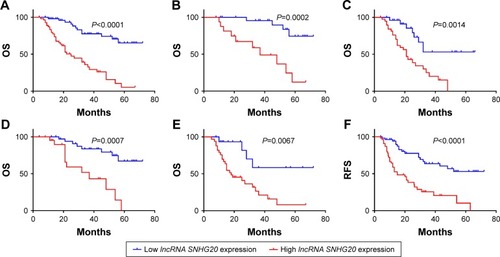
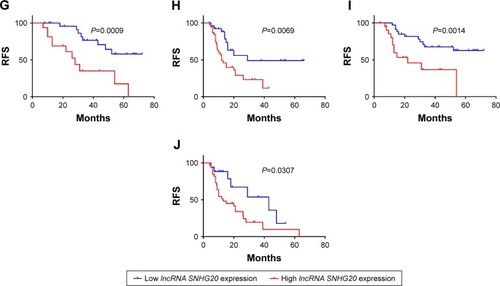
Table 4 Univariate and multivariate analyses for overall survival in glioma patients
Table 5 Univariate and multivariate analyses for recurrence-free survival in glioma patients
Figure 3 SNHG20 siRNA is constructed, which can inhibit the lncRNA SNHG20 expression levels in glioma cells.
Notes: The knockdown efficiency of lncRNA SNHG20 is assessed by qRT-PCR. *P<0.05 means vs the NC siRNA group.
Abbreviation: qRT-PCR, quantitative real-time polymerase chain reaction.
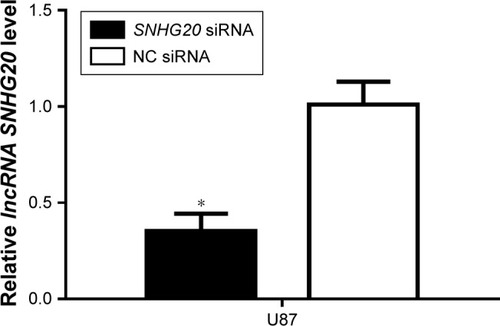
Figure 4 lncRNA SNHG20 modulates the proliferation abilities of glioma U87 cells.
Notes: CCK-8 assays show that lncRNA SNHG20 suppression inhibits the proliferation of glioma U87 cells. *P<0.05 means vs the NC siRNA group.
Abbreviation: CCK-8, cell counting kit-8.
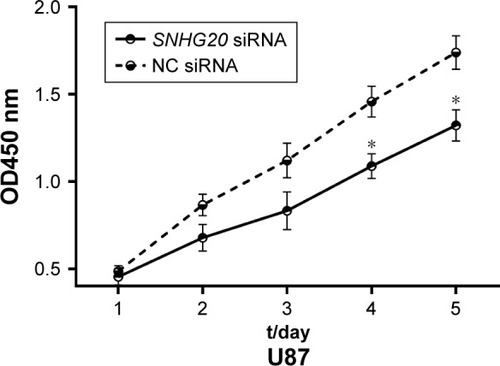
Figure 5 lncRNA SNHG20 modulates the colony formation abilities of glioma U87 cells.
Notes: Colony formation is dramatically reduced following SNHG20 silencing. *P<0.05 vs the NC siRNA group.
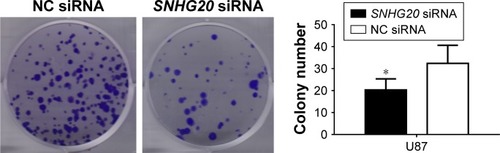
Figure 6 Flow cytometry of the cell cycle distribution of glioma U87 cells transfected with SNHG20 siRNA or NC siRNA.
Note: *P<0.05 vs the NC siRNA group.
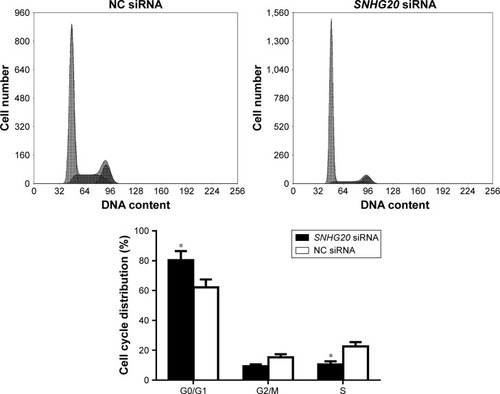
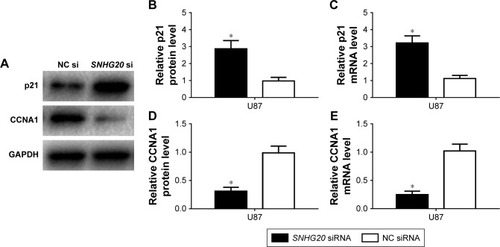
Figure 7 lncRNA SNHG20 modulates the P21 (A–C) and CCNA1 (A, D, E) expression levels in glioma U87cells.
Note: *P<0.05 means vs the NC siRNA group.