Figures & data
Figure 1 Longdaysin inhibits the activity of the Wnt/β-catenin pathway.
Notes: (A) Structure of longdaysin. HEK293T cells were transfected with the SuperTOPFlash reporter plasmid along with empty vector or (B) Wnt1, (C) LRP6, (D) DVL2, (E) CK1δ, (F) CK1ε, (G) CK1δ/LRP6 and CK1ε/LRP6, (H) CK1δ/DVL2 and CK1ε/DVL2, and (I) β-catenin expression plasmids. The transfected cells were then treated with DMSO or 1–50 µM longdaysin for 24 hours. (J) The SuperTOPFlash reporter plasmid was transfected into HEK293T cells. After transfection for 24 hours, the cells were incubated with control or Wnt3A-CM containing DMSO or the indicated amounts of longdaysin for another 24 hours. The luciferase values were normalized to β-gal activities. The results were the average from three independent experiments done by duplicates. Statistical significance between groups was calculated by Student’s t-test. *P<0.05 vs the corresponding vehicle control.
Abbreviation: Wnt3A-CM, Wnt3A-conditioned medium.
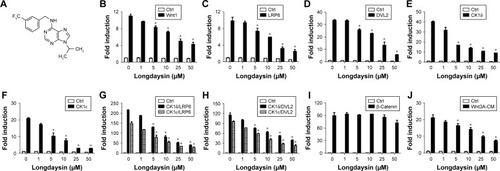
Figure 2 Longdaysin exhibits little inhibitory effect on the luciferase activity of NFAT, AP-1, or 8*GTIIC reporter gene.
Notes: HEK293T cells were transfected with (A) NFAT-Luc reporter together with control vector or NFATc expression plasmid, (B) AP-1-Luc reporter along with control vector or a constitutively active Rasv12 expression plasmid, or (C) 8*GTIIC-Luc reporter along with control vector or YAP expression plasmid. The luciferase values were normalized to β-gal activities. The results were the average from three independent experiments done by duplicates.
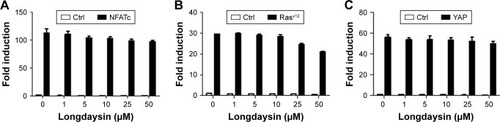
Figure 3 Longdaysin suppresses the Wnt/β-catenin pathway induced by CK1δ and CK1ε in HEK293T cells.
Notes: HEK293T cells were transfected with (A) Flag-tagged CK1δ expression plasmid or (B) Flag-tagged CK1ε expression plasmid. After transfection for 24 hours, the cells were treated with DMSO or the indicated concentrations of longdaysin for another 24 hours. Then, phosphorylated LRP6, total LRP6, DVL2, active β-catenin, total β-catenin, and Flag-tagged CK1δ or CK1ε were detected by immunoblotting. The phosphorylated DVL2 showed slower mobility following SDS/PAGE.
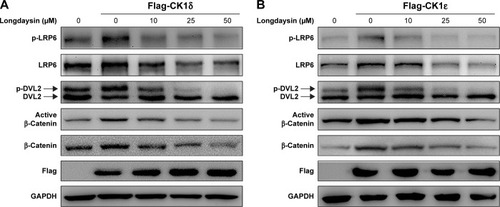
Figure 4 Longdaysin represses the Wnt/β-catenin pathway via targeting CK1δ and CK1ε in breast cancer cells.
Notes: (A and C) Hs578T or (B and D) MDA-MB-231 breast cancer cells were infected with lentivirus containing control shRNA (shC) or shRNAs targeting CK1δ and CK1ε (shCK1), treated with DMSO or the indicated concentrations of longdaysin for 24 hours, and then analyzed by (A and B) immunoblotting to detect the indicated proteins. (C and D) Real-time PCR was used to determine mRNA levels of Wnt target genes Axin2, DKK1, LEF1, and Survivin. Data are expressed as mean ± SD of three replicates. *P<0.05 vs the corresponding vehicle control (Student’s t-test).
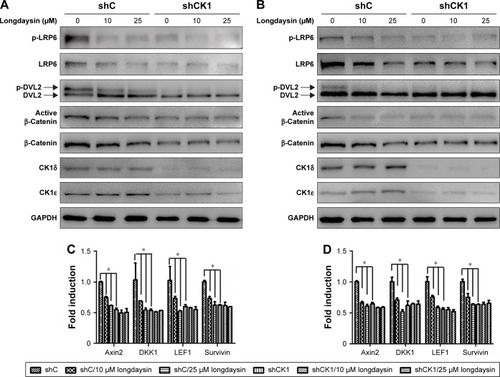
Figure 5 Longdaysin inhibits breast cancer cell colony formation, migration, and invasion through suppressing CK1δ and CK1ε. Hs578T or MDA-MB-231 breast cancer cells were infected by lentivirus containing control shRNA (shC) or shRNAs targeting CK1δ and CK1ε (shCK1).
Notes: (A) Hs578T and MDA-MB-231 cells were seeded and treated with the indicated concentrations of longdaysin for 7 days. Cells were then stained with crystal violet, and stained cells were photographed. The right panel is a graphical illustration of quantitative data of the relative colony numbers per well. (B) Hs578T and MDA-MB-231 cells were transferred into transwells with the indicated concentrations of longdaysin for 6 hours. The migrated cells were stained and photomicrographed. The right panel is a graphical illustration of quantitative cells migrated per field. (C) Hs578T and MDA-MB-231 cells were transferred into transwells coated with Matrigel and incubated with the indicated concentrations of longdaysin for 24 hours. The invaded cells were stained and photomicrographed. The right panel shows a graphical illustration of quantitative cells invaded per field. Data were collected from three independent experiments. *P<0.05.
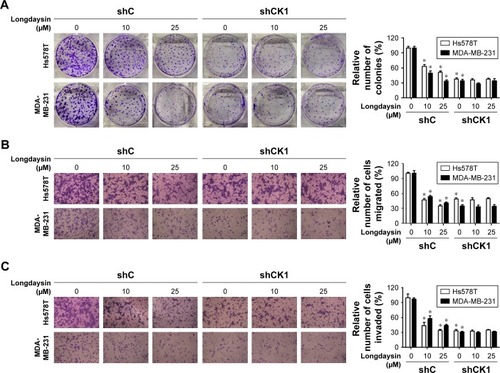
Figure 6 Longdaysin suppresses the sphere-forming ability and the expression of stemness marker genes through inhibition of CK1δ/ε in breast cancer cells.
Notes: (A) Hs578T breast cancer cells were infected with control shRNA (shC) or shRNAs targeting CK1δ and CK1ε (shCK1). Cells were then cultured in Ultra-Low Attachment dishes to examine the ability of sphere formation in the absence or presence of the indicated longdaysin. The number of spheres (diameter >50 µm) was counted under a microscope. (B) Graphical illustration of quantitative data of the relative number of spheres. (C) Hs578T cells were infected with control shRNA (shC) or shRNAs targeting CK1δ and CK1ε (shCK1). Cells were then treated with the indicated concentrations of longdaysin for 24 hours. Real-time PCR was used to determine mRNA levels of stemness marker genes CD44, Slug, and Snail. (D) Hs578T cells were infected by lentivirus containing control shRNA (shC) or shRNAs targeting CK1δ and CK1ε (shCK1). Cells were then treated with the indicated concentrations of longdaysin for 24 hours. CD44, Slug, and Snail were detected by immunoblotting. Scale bar, 100 µm. The results are shown as mean ± SD from three independent experiments. *P<0.05.
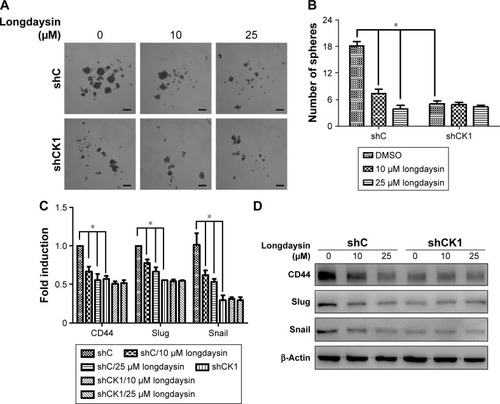
Figure 7 Longdaysin represses tumor growth in MDA-MB-231 xenograft mouse model.
Notes: Established MDA-MB-231 xenografts were treated with 5 mg/kg longdaysin every 3 days for 3 weeks. Eight mice per group were used. (A) Tumor images. (B) Mean tumor volumes. (C) Mean tumor weights. (D) H&E staining; original magnification ×40. Scale bar, 100 µm. (E) Ki-67 staining; original magnification ×40. Scale bar, 100 µm. (F) Active β-catenin antibody staining; original magnification ×40. Scale bar, 100 µm. (G) Total β-catenin antibody staining; original magnification ×40. Scale bar, 100 µm. (H) The expression levels of phosphorylated LRP6, total LRP6, DVL2, active β-catenin, total β-catenin, CD44, Slug, and Snail in tumor samples were detected by immunoblotting. (I) The mRNA expression levels of Axin2, DKK1, LEF1, Survivin, CD44, Slug, and Snail were quantitated by real-time PCR. The results are shown as mean ± SD from three independent experiments. *P<0.05.
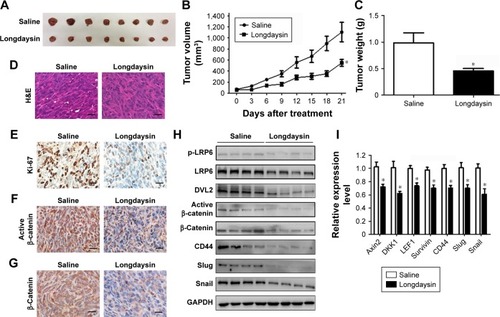
Figure 8 A novel mechanism by which longdaysin inhibits Wnt/β-catenin signaling.
Notes: The Wnt/β-catenin signaling cascade is initiated when a Wnt molecule binds to the Wnt coreceptor LRP6 and a member of the FZD receptor family. CK1δ/ε activity is rapidly upregulated and DVL and LRP6 are phosphorylated, resulting in accumulation of cytoplasmic β-catenin. Longdaysin could decrease phosphorylation of LRP6 and DVL2 through inhibition of CK1δ/ε, and reduce the levels of cytoplasmic β-catenin, finally leading to the transcriptional downregulation of Wnt target genes.
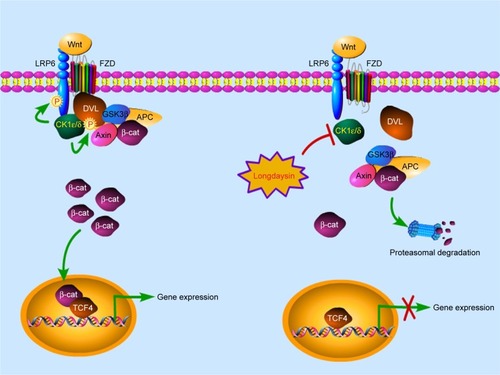
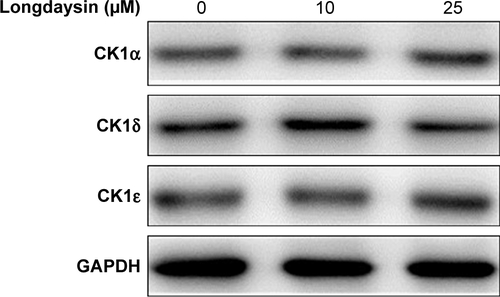
Figure S1 The basal expression of CK1α, CK1δ, and CK1ε in HEK293T cells detected by immunoblotting.