Figures & data
Figure 1 MiR-765 targets APE1 in OS cells. (A) Quantitative reverse-transcription polymerase chain reaction (qRT-PCR) analysis in five osteosarcoma cancer cell lines showed an inverse expression trend between miR-765 and APE1 expression. The expression levels of miR-765 and APE1 were normalized to hFOB1.19. (B) The predicted duplex formation between human WT APE1 3ʹ-UTR and miR-765 is shown. (C) The WT andMut APE1 3ʹ-UTR sequences are shown. (D) Schematic diagram showing luciferase reporter constructs containing the APE1 3ʹ-UTR sequences. (E) Effects of miR-765 mimics (inhibitors) on APE1 3ʹ-UTR luciferase reporters in HOS cells. Empty vector pmirGLO-Report and negative control mimics (N) were included as controls. Luciferase activities were calculated as the ratio of firefly/renilla activities and normalized to the negative control mimics group. The results were obtained from three independent experiments, with each experiment conducted in triplicate. Data are shown as the mean ± SD. (F and G) Western blot analysis was performed to quantify the intracellular APE1 levels. Actin was used as an internal control.
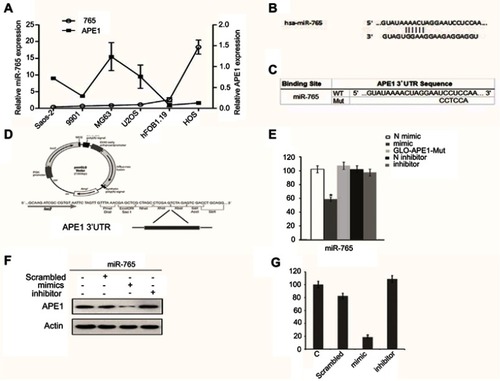
Figure 2 Effect of miR-765 on cisplatin sensitivity through APE1 inhibition. (A and B) 9901/HOS cells were transfected with miR-765 mimics or the miR mimic negative control (miR NC) for 48 hrs. Cell viability was assayed by CCK-8 after treatment with increasing concentrations of cisplatin for 48 hrs. Data are shown as the mean ±95% confidence interval from three independent experiments. (C and D) 9901/HOS cells were transfected with APE1 siRNA or the siRNA negative control (miR NC) for 48 hrs. Cell viability was assayed by CCK-8 after treatment with increasing concentrations of cisplatin for 48 hrs. Data are shown as the mean ±95% confidence interval from three independent experiments. (E and F) 9901/HOS cells were cotransfected with miR-765 mimics and siAPE1 (siNC) for 48 hrs. Cell viability was assayed by CCK-8 after treatment with increasing concentrations of cisplatin for 48 hrs. Data are shown as the mean ±95% confidence interval from three independent experiments.
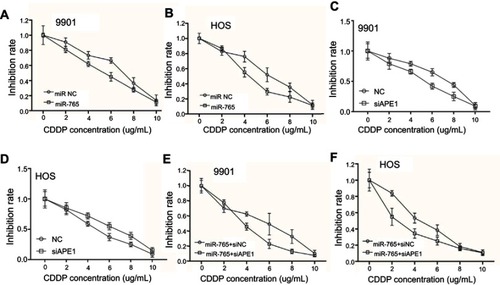
Figure 3 Effect of miR-765 on DNA repair through APE1 inhibition. The number of γ-H2AX foci/cell was counted in a minimum of 200 cells per treatment group. The average number of γ-H2AX foci/cell is shown. Error bars indicate S.D. * p<0.05. (A and B) The representative images of 9901 cells transfected with miR-765 mimics or the miR NC and treated with cisplatin (5 ug/ml) from the 6 hr groups are shown. (C and D) The representative images of 9901 cells cotransfected with miR-765 mimics and siAPE1 (siNC) and treated with cisplatin (5 µg/ml) from the 6 hr groups are shown.
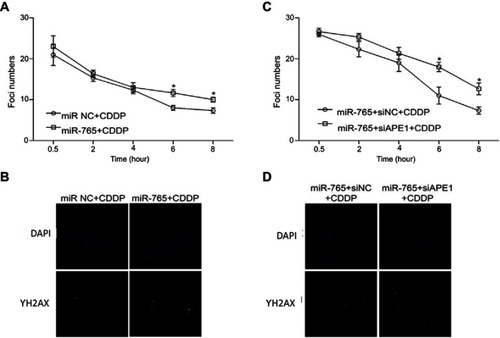
Figure 4 Effect of miR-765 on tumor growth combined with cisplatin in the xenograft model. (A) Growth curves of 9901 subcutaneous xenograft tumors treated with vehicle, cisplatin (5 mg/kg, intraperitoneally every 4 days) plus agomiR-765 (1 nmol, intratumoral injection, every 4 days), or cisplatin (5 mg/kg, intraperitoneally every 4 days) plus agomiR-scramble-NC (1 nmol, intratumoral injection, every 4 days) are shown. Tumor volumes were calculated as length × (square of width)/2. Upwards and downwards arrows indicate the start and end of treatment, respectively. n=4 per group (**p<0.005, two-sided Student t-test). (B) The gross morphology of tumors measured on day 35 after tumor cell injection. (C) The tumors were weighed immediately after isolation from mice (**p<0.005, two-sided Student t-test). (D) The immunohistochemistry analyses for APE1 and Ki67, along with TUNEL staining, were carried out on 9901 xenograft tumor sections collected from mice treated with the indicated treatments. Representative staining samples are shown.
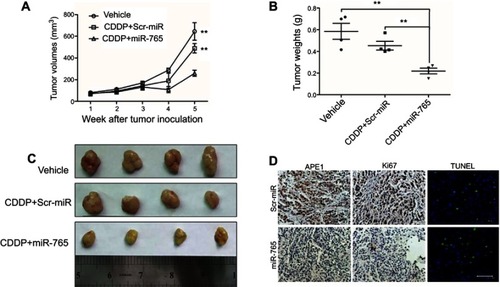
Table 1 The demographic and clinical characteristics for the research group
Table 2 The correlation between miR-765 and APE1 expression in OS patients
Figure 5 Clinical validation of miR-765 and APE1. (A) APE1 and miR-765 expression are inversely correlated in osteosarcoma samples. Patients were divided equally into two groups according to miR-765 expression level, and APE1 expression showed considerable differences between the miR-765 low and miR-765 high groups (p=0.0034, Mann–Whitney U test). (B) Paraffin-embedded, formalin-fixed osteosarcoma cancer tissues were incubated with a locked nucleic acid anti-miR-765 probe for in situ hybridization (ISH) and anti-APE1 antibody for immunohistochemical (IHC) analysis with scrambled probe and phosphate-buffered saline as negative controls, respectively. Representative photographs are shown. Scale bars =50 μm. (C and D) A Kaplan–Meier analysis of overall survival for osteosarcoma patients with the corresponding expression profiles of APE1 (D) and miR-765 (C) is shown (p=0.039 and p=0.001, respectively, log-rank test).
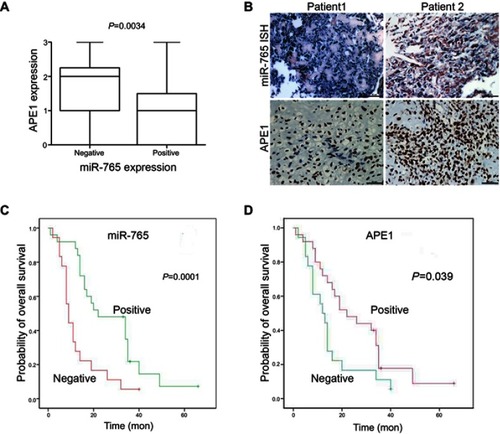
Table 3 The univariate and multivariate analyses of prognostic factors in 43 patients with osteosarcoma for overall survival
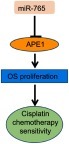
Figure 6 Graphic summary of this study.