Figures & data
Figure 1 DMAMCL inhibits the viability of glioma cells and induces cell death.
Notes: (A) Dose- and time-dependent effects of DMAMCL on cell viability. U87-MG and U251 glioma cells were administered different concentrations of DMAMCL (10, 20, 30, 40, 50, and 60 μM) for 24, 48, and 72 hours, and cell viability was assessed via CCK-8 assays. *Indicates statistically significant difference (P<0.05) vs untreated control cells. (B, C) Effects of DMAMCL, ROS scavenger NAC, and Akt activator IGF-1 on U87-MG and U251 cells. The percentage of dead cells (red) increased compared with the control. *Indicates statistically significant difference (P<0.05) vs untreated control cells. #Indicates significantly different (P<0.05) compared with DMAMCL treatment. Scale bars =50 μm. (D) The CCK-8 proliferation assay using U87-MG and U251 cells was performed with different treatments (40 μM DMAMCL for 48 hours; 3-MA [100 nM] for 48 hours; 40 μM DMAMCL and 3-MA [100 nM] for 48 hours; pretreatment with NAC [5 mM] for 2 hours and then culture media for 48 hours; pretreatment with NAC [5 mM] for 2 hours, followed by 40 μM DMAMCL for 48 hours; IGF-1 [100 ng/mL] for 48 hours; 40 μM DMAMCL and IGF-1 [100 ng/mL] for 48 hours). *Indicates statistically significant (P<0.05) vs untreated control cells. #Indicates significantly different (P<0.05) compared with DMAMCL treatment. Data are expressed as the mean ± SD of three independent experiments.
Abbreviations: 3-MA, 3-methyladenine; CCK-8, Cell Counting Kit-8; DMAMCL, dimethylaminomicheliolide; IGF-1, insulin-like growth factor-1; NAC, N-acetyl-L-cysteine; ROS, reactive oxygen species.
![Figure 1 DMAMCL inhibits the viability of glioma cells and induces cell death.Notes: (A) Dose- and time-dependent effects of DMAMCL on cell viability. U87-MG and U251 glioma cells were administered different concentrations of DMAMCL (10, 20, 30, 40, 50, and 60 μM) for 24, 48, and 72 hours, and cell viability was assessed via CCK-8 assays. *Indicates statistically significant difference (P<0.05) vs untreated control cells. (B, C) Effects of DMAMCL, ROS scavenger NAC, and Akt activator IGF-1 on U87-MG and U251 cells. The percentage of dead cells (red) increased compared with the control. *Indicates statistically significant difference (P<0.05) vs untreated control cells. #Indicates significantly different (P<0.05) compared with DMAMCL treatment. Scale bars =50 μm. (D) The CCK-8 proliferation assay using U87-MG and U251 cells was performed with different treatments (40 μM DMAMCL for 48 hours; 3-MA [100 nM] for 48 hours; 40 μM DMAMCL and 3-MA [100 nM] for 48 hours; pretreatment with NAC [5 mM] for 2 hours and then culture media for 48 hours; pretreatment with NAC [5 mM] for 2 hours, followed by 40 μM DMAMCL for 48 hours; IGF-1 [100 ng/mL] for 48 hours; 40 μM DMAMCL and IGF-1 [100 ng/mL] for 48 hours). *Indicates statistically significant (P<0.05) vs untreated control cells. #Indicates significantly different (P<0.05) compared with DMAMCL treatment. Data are expressed as the mean ± SD of three independent experiments.Abbreviations: 3-MA, 3-methyladenine; CCK-8, Cell Counting Kit-8; DMAMCL, dimethylaminomicheliolide; IGF-1, insulin-like growth factor-1; NAC, N-acetyl-L-cysteine; ROS, reactive oxygen species.](/cms/asset/569f51fa-dee8-4e4c-9ebe-7855128e20f8/dott_a_195329_f0001_c.jpg)
![Figure 1 DMAMCL inhibits the viability of glioma cells and induces cell death.Notes: (A) Dose- and time-dependent effects of DMAMCL on cell viability. U87-MG and U251 glioma cells were administered different concentrations of DMAMCL (10, 20, 30, 40, 50, and 60 μM) for 24, 48, and 72 hours, and cell viability was assessed via CCK-8 assays. *Indicates statistically significant difference (P<0.05) vs untreated control cells. (B, C) Effects of DMAMCL, ROS scavenger NAC, and Akt activator IGF-1 on U87-MG and U251 cells. The percentage of dead cells (red) increased compared with the control. *Indicates statistically significant difference (P<0.05) vs untreated control cells. #Indicates significantly different (P<0.05) compared with DMAMCL treatment. Scale bars =50 μm. (D) The CCK-8 proliferation assay using U87-MG and U251 cells was performed with different treatments (40 μM DMAMCL for 48 hours; 3-MA [100 nM] for 48 hours; 40 μM DMAMCL and 3-MA [100 nM] for 48 hours; pretreatment with NAC [5 mM] for 2 hours and then culture media for 48 hours; pretreatment with NAC [5 mM] for 2 hours, followed by 40 μM DMAMCL for 48 hours; IGF-1 [100 ng/mL] for 48 hours; 40 μM DMAMCL and IGF-1 [100 ng/mL] for 48 hours). *Indicates statistically significant (P<0.05) vs untreated control cells. #Indicates significantly different (P<0.05) compared with DMAMCL treatment. Data are expressed as the mean ± SD of three independent experiments.Abbreviations: 3-MA, 3-methyladenine; CCK-8, Cell Counting Kit-8; DMAMCL, dimethylaminomicheliolide; IGF-1, insulin-like growth factor-1; NAC, N-acetyl-L-cysteine; ROS, reactive oxygen species.](/cms/asset/220c3b44-4be7-4dd1-b4fe-465498171c62/dott_a_195329_f0001a_b.jpg)
Figure 2 DMAMCL induces a decrease in MMPs in glioma cells.
Notes: (A, B) The MMP of U87-MG and U251 cells with ascending concentrations of DMAMCL as determined by flow cytometric analysis using JC-1 as a mitochondrial fluorescent probe. *Indicates statistically significant (P<0.05) vs untreated control cells.
Abbreviations: DMAMCL, dimethylaminomicheliolide; MMPs, mitochondrial membrane potentials.
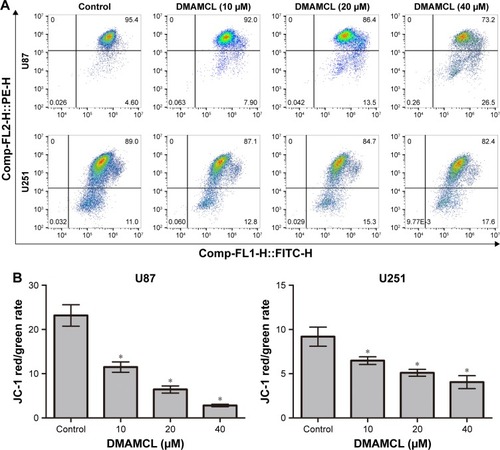
Figure 3 DMAMCL induces apoptosis in glioma cells.
Notes: (A, B) After treatment with the indicated concentrations of DMAMCL for 48 hours, apoptosis was detected using Annexin V-FITC/PI staining and the percentage of apoptotic cells compared with the untreated control groups was quantitatively analyzed. (C) The apoptosis biomarkers Bcl-2, Bax, and caspase-3 were measured after cells were treated with different concentrations of DMAMCL (10, 20, 40 μM) for 48 hours by Western blot analysis. GAPDH is shown as a loading control. The results shown are one representative of three independent experiments. *P<0.05 vs the control group.
Abbreviations: DMAMCL, dimethylaminomicheliolide; FITC, fluorescein isothiocyanate; GAPDH, glyceraldehyde 3-phosphate dehydrogenase; PI, propidium iodide.
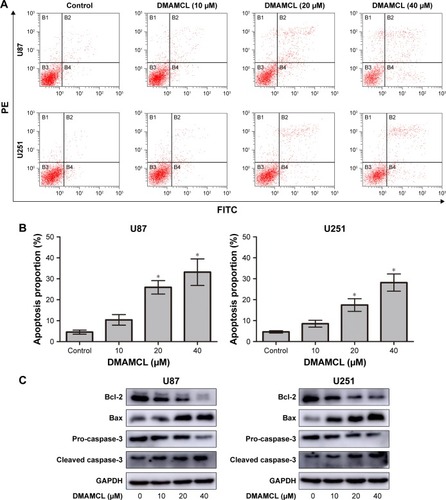
Figure 4 DMAMCL induces autophagy activity but inhibits autophagy flux in glioma cells.
Notes: (A) The representative ultrastructure of autophagic vesicles (red arrows) was observed after U87-MG and U251 cells were treated with DMAMCL (40 μM) for 48 hours with transmission electron micrographs. Scale bars =4 μm. (B) Effects of DMAMCL on LC3B-II, Beclin-1, and P62 levels in U87-MG and U251 cells. (C–F) mRFP-GFP-LC3 adenovirus infection showed that being culturing with DMAMCL (40 μM) for 48 hours enhanced autophagosome accumulation and inhibited the fusion of autophagosomes with lysosomes. The green puncta represented autophagosomes, and the red puncta represented autolysosomes. Scale bars =10 μm. (G) Effects of 3-MA on DMAMCL-mediated expression levels of LC3B-II, Bcl-2 and BAX. All experiments were conducted in triplicate, and the results are displayed as the mean±SD. *P<0.05 versus the control group.
Abbreviations: 3-MA, 3-methyladenine; DMAMCL, dimethylaminomicheliolide.
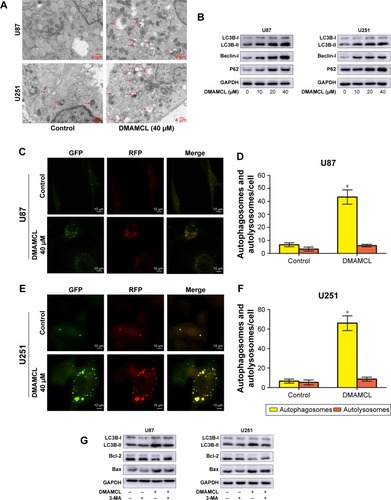
Figure 5 DMAMCL induces ROS generation.
Notes: (A) After treatment with DMAMCL (40 μM) for 6 hours, the ROS level was increased compared with the control group, and pretreatment with the antioxidant NAC can reduce the ROS level. Scale bars =50 μm. (B) The representative antioxidant response elements increased after treatment with increasing concentrations of DMAMCL (10, 20, 40 μM) for 48 hours as determined by Western blot analysis. (C) DMAMCL promotes the Nrf-ARE antioxidant pathway. Immunofluorescence analyses were performed to assess Nrf-2, HO-1, and TXNRD-1 expression levels after DMAMCL administration. The results showed that Nrf-2 showed clear nuclear translocation, and the levels of the downstream HO-1 and TXNRD-1 were also evaluated. Scale bars =20 μm. Data are expressed as the mean ± SD of three independent experiments.
Abbreviations: ARE, antioxidant response elements; DMAMCL, dimethylaminomicheliolide; HO-1, heme oxygenase 1; NAC, N-acetyl-L-cysteine; Nrf2, nuclear factor erythroid 2-related factor 2; ROS, reactive oxygen species.
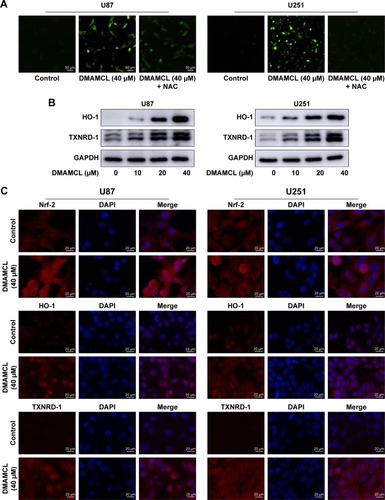
Figure 6 DMAMCL regulates the ROS/MAPK signaling pathway and inhibits the Akt/mTOR signaling pathway.
Notes: DMAMCL suppressed the Akt/mTOR pathway and regulated the ROS/MAPK pathway in human glioma cells in a dose-dependent manner. The cells were treated with various concentrations of DMAMCL (10, 20, 40 μM) for 6 and 48 hours to measure the effects on MAPK signaling pathway and Akt/mTOR signaling pathway, respectively. GAPDH served as the loading control. The blots shown are one representative of three independent experiments (P<0.05).
Abbreviations: DMAMCL, dimethylaminomicheliolide; GAPDH, glyceraldehyde 3-phosphate dehydrogenase; MAPK, mitogen-activated protein kinase; ROS, reactive oxygen species.
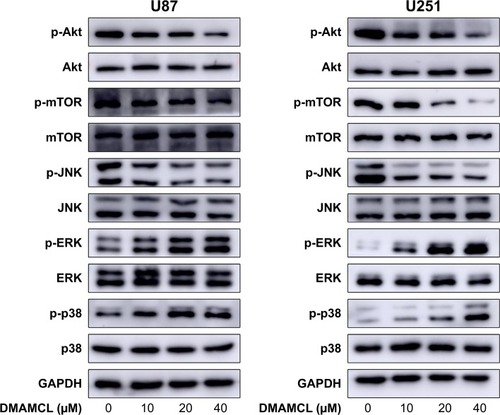
Figure 7 The relationship between the autophagy induced by DMAMCL and the ROS/MAPK and Akt/mTOR signaling pathways.
Notes: (A) Effects of NAC on DMAMCL-induced autophagy and MAPKs in U87-MG and U251 cells. The cells were treated with DMAMCL (40 μM) in the absence or presence of NAC for 6 hours; (B) Effects of IGF-1 on DMAMCL-induced autophagy and the Akt/mTOR signaling pathway in U87-MG and U251 cells. The cells were treated with DMAMCL (40 μM) in the absence or presence of IGF-1 for 48 hours. GAPDH is shown as a loading control. The results shown are one representative of three independent experiments (P<0.05).
Abbreviations: DMAMCL, dimethylaminomicheliolide; GAPDH, glyceraldehyde 3-phosphate dehydrogenase; IGF-1, insulin-like growth factor-1; MAPK, mitogen-activated protein kinase; NAC, N-acetyl-L-cysteine; ROS, reactive oxygen species.
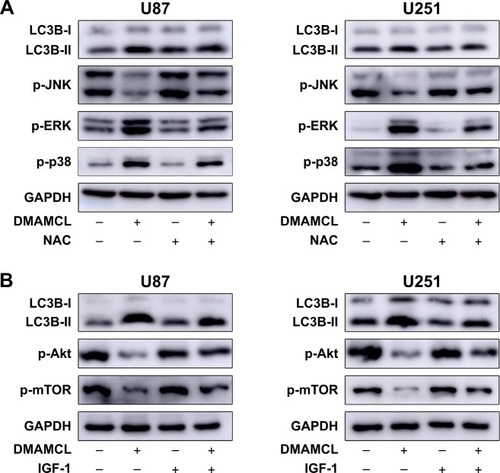
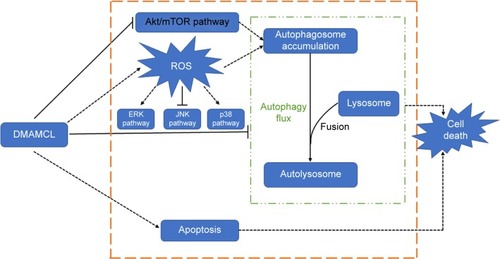
Figure 8 Proposed mechanism of DMAMCL-mediated cell death in human glioma cells.
Abbreviations: DMAMCL, dimethylaminomicheliolide; ROS, reactive oxygen species.