Figures & data
Table 1 Association between miR-125b expression and clinicopathological characteristics
Figure 1 The expression levels of miR-125b and HMGA1 were upregulated in CC tissues and cell lines. (A) The expression levels of miR-125b in the Endl/E6E7 and CC cell lines (Caski, HeLa, C4-1, SW756, and SiHa). (B) The expression levels of miR-125b in the 112 pairs of CC tissues and adjacent normal tissues. (C) The expression levels of HMGA1 mRNA in the 112 pairs of CC tissues and adjacent normal tissues. (D) Correlation of expression levels between miR-125b and HMGA1 mRNA in the CC tissues; *P<0.05.
Abbreviation: CC, cervical cancer.
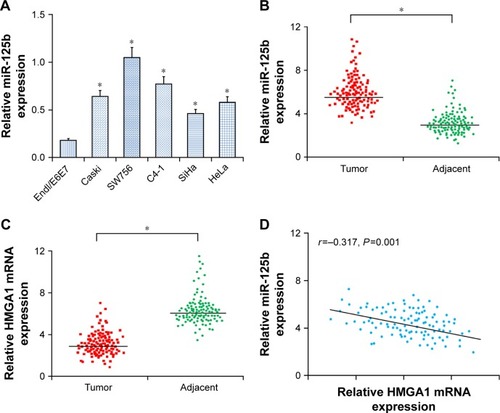
Figure 2 Clinical significance of miR-125b in patients with CC. (A) Comparison of miR-125b expression levels between patients with metastatic and non-metastatic CC. (B) Comparison of miR-125b expression levels between patients with relapsed and non-relapsed CC. (C) The OS of the CC patients with low and high expression levels of miR-125b. (D) The PFS of the CC patients with low and high expression levels of miR-125b; *P<0.05.
Abbreviations: CC, cervical cancer; OS, overall survival; PFS, progression-free survival.
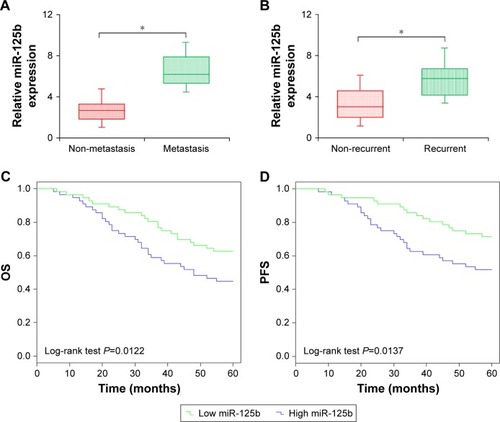
Table 2 Univariate and multivariate analyses of correlations between clinicopathological parameters and OS
Table 3 Univariate and multivariate analyses of clinicopathological parameters in relation to PFS
Figure 3 Effects of miR-125b knockdown on proliferation and cell cycle of the CC cells. (A) Expression levels of miR-125b in SW756 and C4-1 cells transfected with miR-125b inhibitors. (B) Effects of miR-125b knockdown on the viability of SW756 and C4-1 CC cells. (C, D) Effects of miR-125b knockdown on the colony formation abilities of SW756 and C4-1 CC cells. (E, F) Effects of miR-125b knockdown on the cell cycle progression of SW756 and C4-1 CC cells; *P<0.05.
Abbreviations: CC, cervical cancer; NC, negative control.
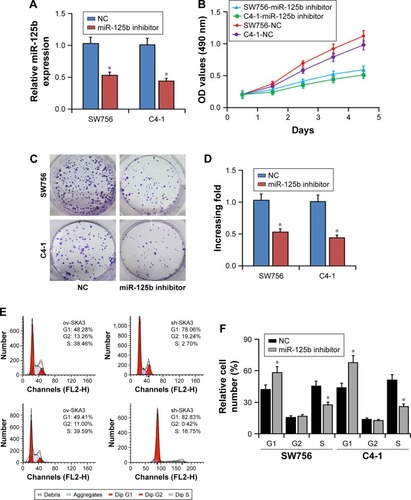
Figure 4 HMGA1 was a direct target gene for miR-125b. (A) RT-qPCR was used to detect the expression levels of p21 and cyclin D1 mRNA in the SW756 and C4-1 cells after transfection with miR-125b or NC. (B) Western blot analysis was used to detect the expression levels of p21 and cyclin D1 proteins in SW756 and C4-1 cells after transfection with miR-125b or NC. (C) RT-qPCR was used to detect the expression levels of HMGA1 mRNA in SW756 and C4-1 cells after transfection with miR-125b or NC. (D) Western blot analysis was used to detect the expression levels of HMGA1 protein in SW756 and C4-1 cells after transfection with miR-125b or NC. (E) The miR-125b and its putative binding sequences in HMGA1 3′-UTR. (F) SW756 and C4-1 cells were transfected with plasmids containing WT or MT-type HMGA1 3′-UTR and miR-125b inhibitor oligonucleotides for luciferase reporter gene experiments; *P<0.05.
Abbreviations: RT-qPCR, real-time quantitative PCR; NC, negative control; WT, wild type; MT, mutant.
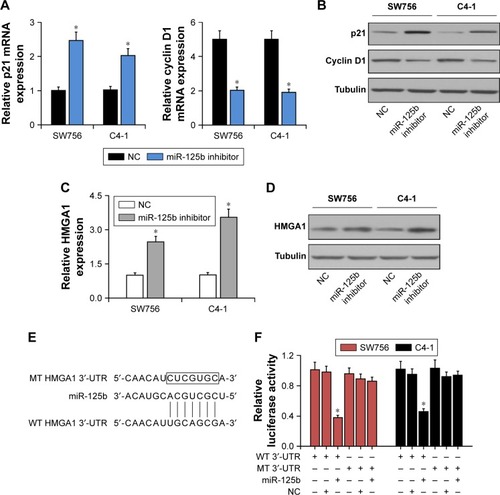
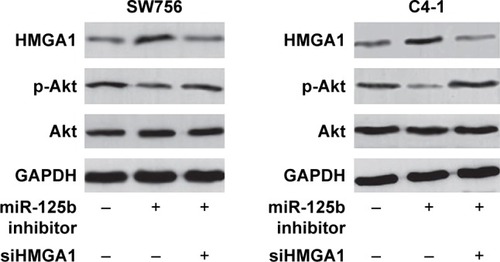
Figure 5 miR-125b regulated PI3K/Akt pathway through suppression of HMGA1. The primary Akt protein level was detected after co-transfection with miRNA inhibitor and siHMGA1 in SW756 and C4-1 cells.