Figures & data
Figure 1 TPM4 was not involved in cell proliferation. (A) TPM4 was extensively expressed in lung cancer cells. The level of TPM4 in lung cancer cells was determined by western blot. GAPDH is used as a loading control. (B) TPM4 knockout cell model was constructed by CRISPR/CAS9. TPM4 protein level was detected by Western blot, with GADPH used as the internal loading controls. (C, D) Cells were seeded in 96-well plates and an MTS assay was performed. Absorbance at 490 nm (y axis) was measured at 24-hr intervals. The data are expressed as the mean ± standard error of the mean from three separate experiments.
Abbreviations: CRISPR, clustered, regular lyinterspaced, short palindromic repeats; MTS, 3-(4,5-dimethylthiazol-2-yl)-5-(3-carboxymethoxyphenyl)-2-(4-sulfophenyl)-2H-tetrazolium.
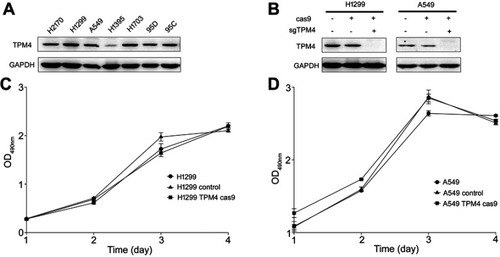
Figure 2 TPM4 was involved in lung cancer cell migration. (A,B) Transwell migration assay performed. Cells migrated through the chamber was counted in five microscopic fields and standardized by H1299 group and A549 group, respectively. The data is expressed as mean ± SEM. Bars represent 50 μm. ** p<0.01 (unpaired Student's t-test). (C) Wound healing assay was performed with TPM4 knock out cell clones as well as control cells for 0–16 hrs. Bars represent 50 μm. (D) Expression of mesenchymal proteins, vimentin and β-catenin, transcription factors, snail, and ZEB1 was examined by immunoblotting. GAPDH is used as a loading control.
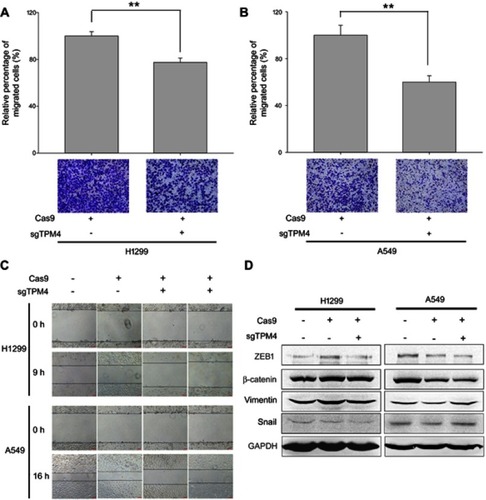
Figure 3 Downregulation of TPM4 led to disruption of actin organization. (A) F-actin expression level was detected by WB. The actin level was also determined as a control, with GADPH used as the internal loading controls. (B, C) F-actin and TPM4 were labeled by immunofluorescence staining. The red signal represents the staining of F-actin, the green signal represents the staining of TPM4, and the blue signal represents the nuclear DNA staining by Hoechst 33342. Bars represent 20 μm.
Abbreviation: WB, Western blot.
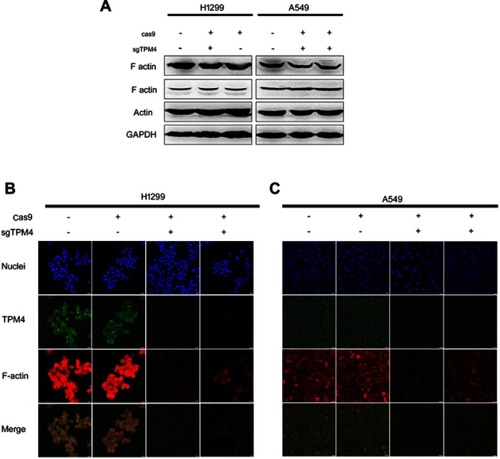
Figure 4 TPM4 promoted H1299 and A549 cell migration. (A) TPM4 upregulation cell model was obtained and the expression of TPM4 was determined by WB. GAPDH is used as a loading control. (B) Expression of mesenchymal proteins, vimentin and β-catenin, transcription factors, snail, and ZEB1 was examined by immunoblotting. GAPDH is used as a loading control. (C, D) Transwell migration assay was performed. Cells migrated through the chamber were counted in five microscopic fields and normalized to H1299 group or A549 group, respectively. The data is expressed as mean ± SEM. Bars represent 50 μm. ** p<0.01 (unpaired Student t-test). (E) wound scratch assay was performed. The wounds were observed and recorded at 0 hr, 9 hrs, and 16 hrs along the scratch, respectively. Bars represent 50 μm.
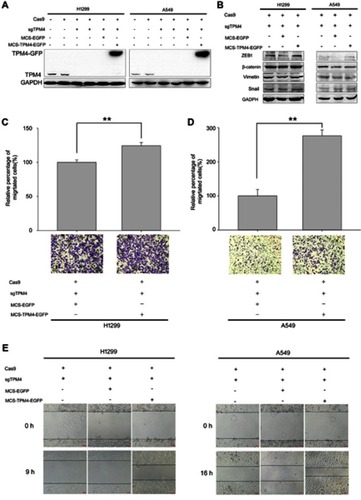
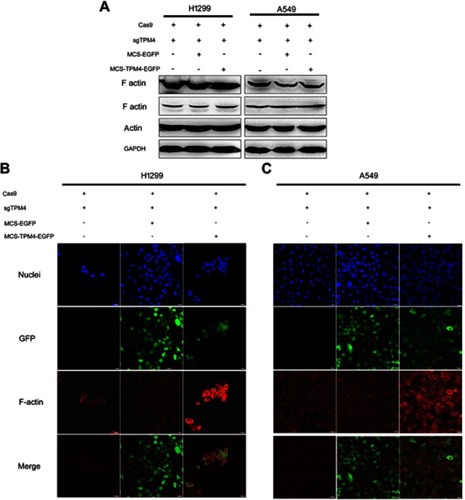
Figure 5 F-actin assembly was increased when TPM4 was upregulated. (A) WB technique was used to determine F-actin level in TPM4 upregulating cells as well as control cells. The actin level was used as a control, with GADPH used as the internal loading controls. (B, C) F-actin was labeled by immunofluorescence staining. The red signal represents the staining of F-actin, the green signal represents the fluorescence of GFP, and the blue signal represents the nuclear DNA staining by Hoechst 33342. Bars represent 20 μm.
Abbreviation: WB, Western blot.