
Figures & data
Figure 1 PRISMA flow diagram.Abbreviations: PRISM, Preferred Reporting Items for Systematic Reviews and Meta-Analyses; SLR, systematic literature review; MWA, microwave ablation; RFA, radiofrequency ablation.
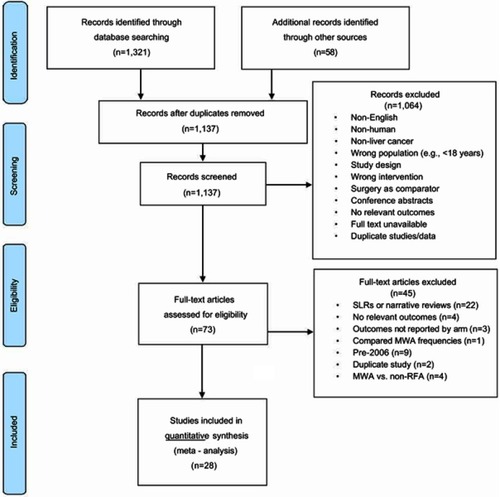
Table 1 Study and baseline characteristics for studies included in the meta-analysis
Figure 2 Forest plot of random-effects meta-analysis results for LTP (P=0.02), stratified by RCTs (P=0.01) versus observational studies (P=0.07).
Abbreviations: LTP, local tumor progression; RCT, randomized control trial.
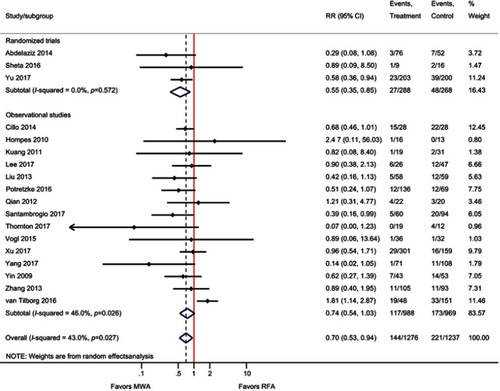
Figure 3 Weighted one-, three-, and five-year OS and DFS for MWA and RFA.
Notes: The error bars represent the 95% CIs for each estimate.
Abbreviations: DFS, disease-free survival; MWA, microwave ablation; OS, overall survival; RFA, radiofrequency ablation.
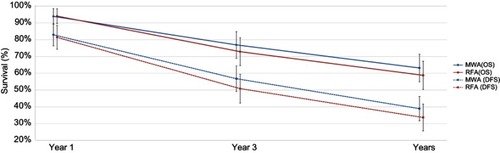
Figure 4 Summary of meta-analyses.
Abbreviations: DFS, disease-free survival; EHM, extrahepatic metastasis; IDL, intrahepatic de novo lesions; OS, overall survival.
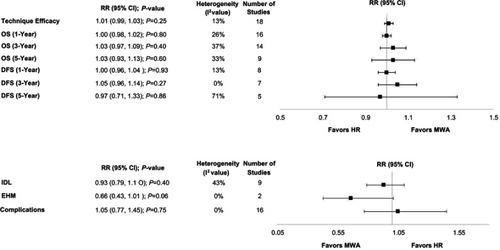
Figure 5 Funnel plot assessing publication bias for LTP in 18 studies. Red points indicate RCTs and blue points indicate observational studies.
Abbreviation: LTP, local tumor progression; MWA, microwave ablation; RCT, randomized control trial; RFA, radiofrequency ablation.
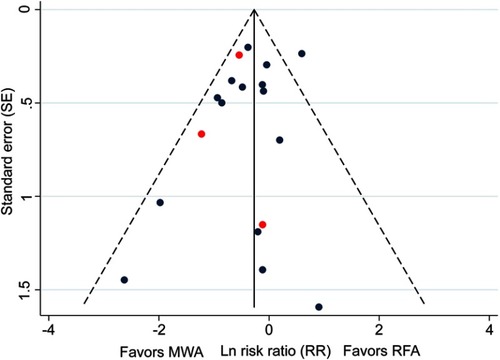
Figure S1 Methodological quality assessment of RCTs using the Cochrane RoB tool.
Abbreviations: RCT, randomized control trial; RoB, Risk of Bias.
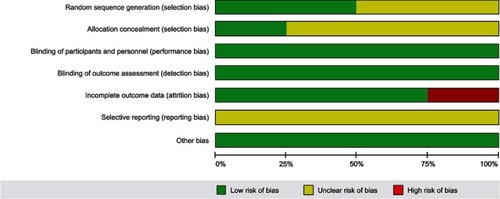
Figure S2 Forest plot of random effects meta-analysis results for technique efficacy (P=0.25), stratified by RCTs (P=0.23) versus observational studies (P=0.34).
Abbreviation: RCT, randomized control trial.
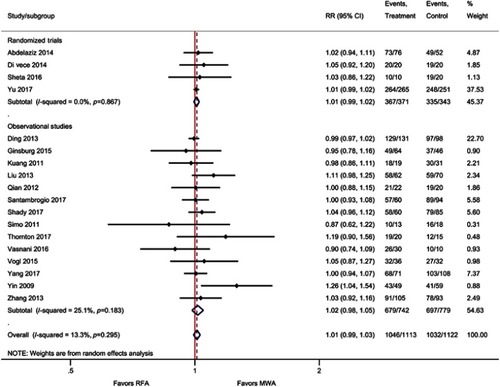
Figure S3 Forest plot of random effects meta-analysis results for one-year OS (P=0.80), stratified by RCTs (P=0.43) versus observational studies (P=0.57).
Abbreviations: OS, overall survival; RCT, randomized control trial.
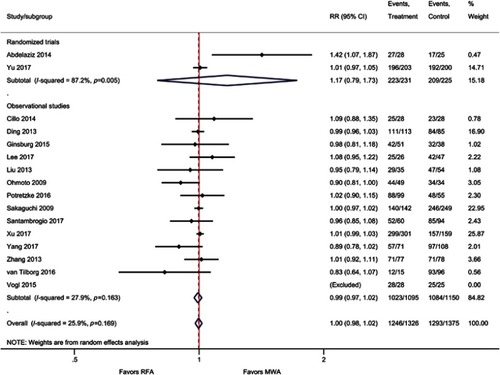
Figure S4 Forest plot of random effects meta-analysis results for three-year OS (P=0.40), stratified by RCTs (P=0.94) versus observational studies (P=0.38).
Abbreviations: OS, overall survival; RCT, randomized control trial.
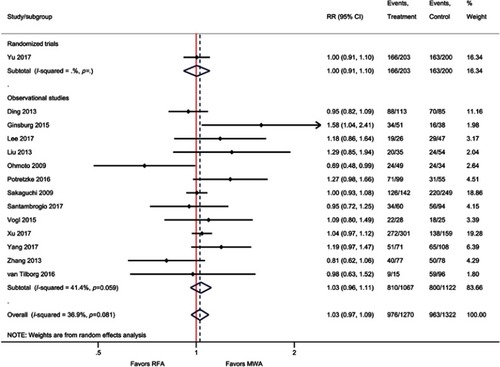
Figure S5 Forest plot of random effects meta-analysis results for five-year OS (P=0.60), stratified by RCTs (P=0.27) versus observational studies (P=0.32).
Abbreviations: OS, overall survival; RCT, randomized control trial.
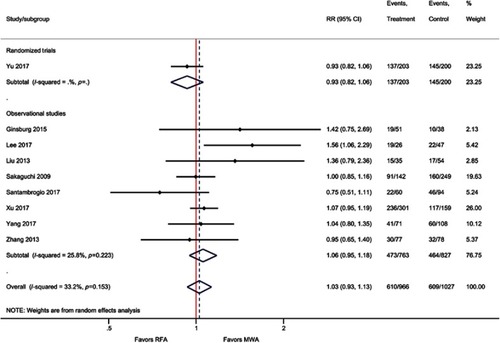
Figure S6 Forest plot of random effects meta-analysis results for one-year DFS (P=0.93), stratified by RCTs (P=0.97) versus observational studies (P=0.67).
Abbreviations: DFS, disease-free survival; RCT, randomized control trial.
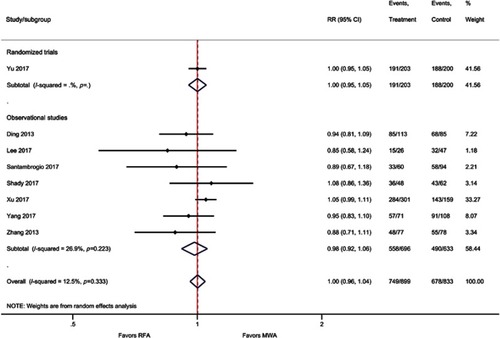
Figure S7 Forest plot of random effects meta-analysis results for three-year DFS (P=0.27), stratified by RCTs (P=0.34) observational studies (P=0.73).
Abbreviations: DFS, disease-free survival; RCT, randomized control trial.
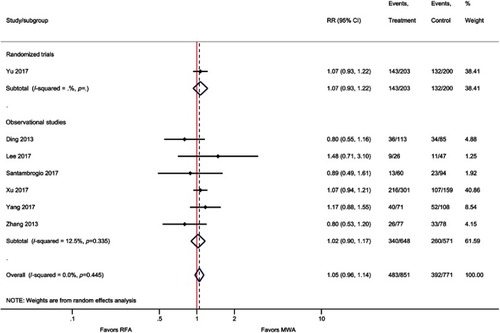
Figure S8 Forest plot of random effects meta-analysis results for five-year DFS (P=0.86), stratified by RCTs (P=0.006) versus observational studies (P=0.045).
Abbreviations: DFS, disease-free survival; RCT, randomized control trial.
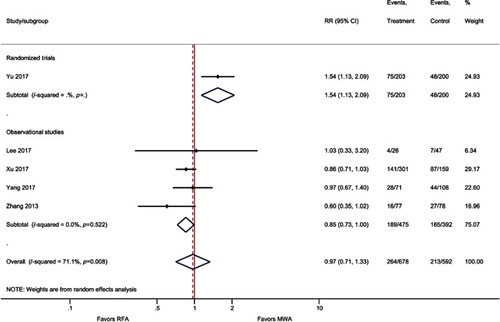
Figure S9 Forest plot of random effects meta-analysis results for EHM (P=0.056).
Abbreviation: EHM, extrahepatic metastasis.
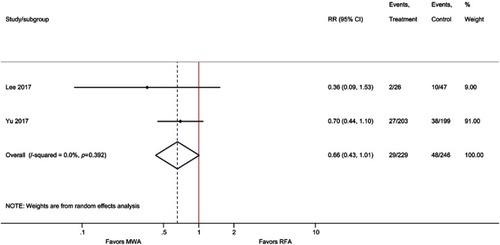
Figure S10 Forest plot of random effects meta-analysis results for IDL (P=0.40), stratified by RCTs (P=0.034) versus observational studies (P=0.83).
Abbreviations: IDL, intrahepatic de novo lesions; RCT, randomized control trial.
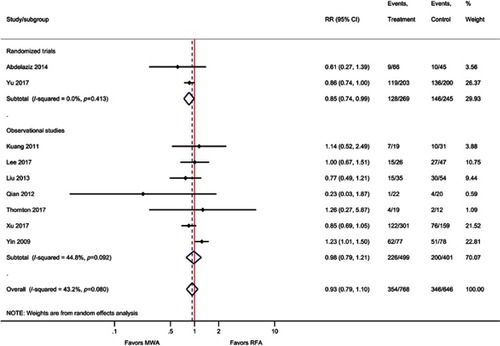
Figure S11 Forest plot of random effects meta-analysis results for LOS (P=0.26).
Abbreviation: LOS, length of stay.
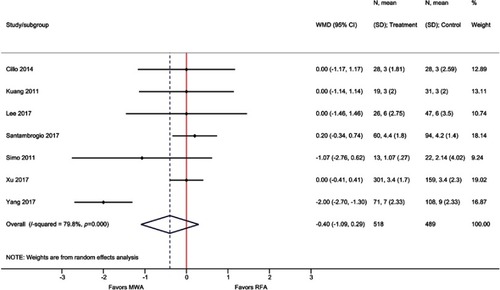
Figure S12 Forest plot of random effects meta-analysis results for complications (P=0.75), stratified by RCTs (P=0.68) versus observational studies (P=0.60).
Abbreviation: RCT, randomized control trial.
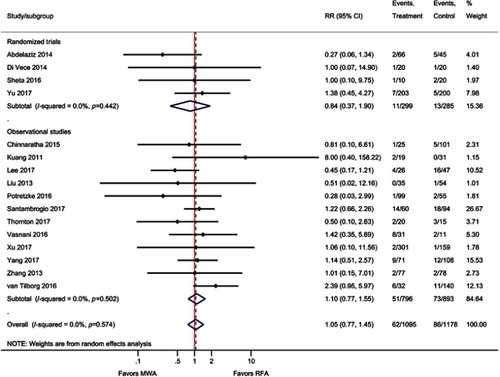
Figure S13 Publication Bias Assessments.
Notes: Funnel plots assessing publication bias for (A) technique efficacy (n=18), (B) one-year OS (n=15), (C) three-year OS (n=14), and (D) complications (n=16). Red points indicate RCTs and blue points indicate observational studies.
Abbreviations: MWA, microwave ablation; OS, overall survival; RCT, randomized control trial; RFA, radiofrequency ablation.
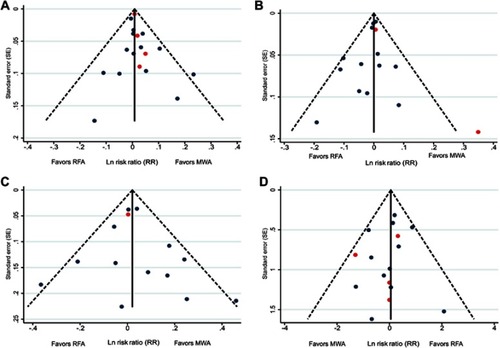
Table 2 Summary of analyses for MWA compared with RFA
Table 3 Summary of subgroup analyses for MWA compared with RFA
Table 4 Summary of sensitivity analyses for MWA compared with RFA
Table S1 Summary of patient retreatment after initial thermal ablation with MWA or RFA
Table S2 Methodological quality assessment of RCTs using the Cochrane RoB tool
Table S3 Methodological quality assessment of observational studies using the NOS scalea
Data availability
The dataset supporting the conclusions of this article is included in the article (and its supplementary data).