Figures & data
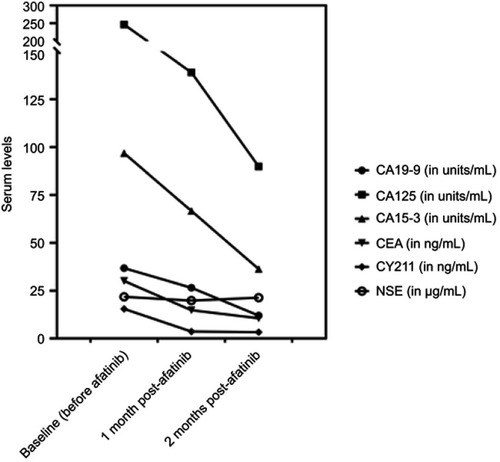
Figure 1 Thoracic computed tomography images illustrating the size reduction of the pulmonary lesions after 2 months of afatinib treatment (lower panels) as compared to baseline (top panels).
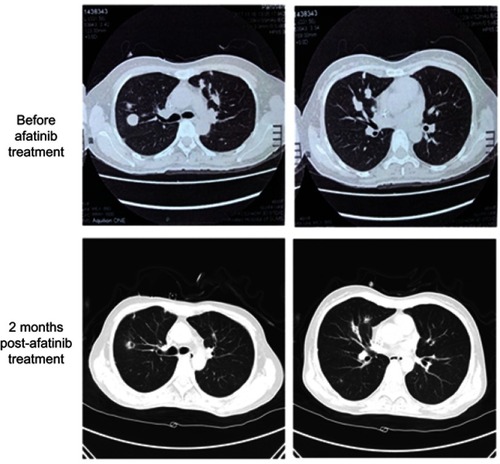
Figure 2 Serum tumor biomarker levels reduced after 1 to 2 months of afatinib treatment. Serum levels of biomarkers including CEA and CY211 expressed in ng/mL, CA19-9, CA125, CA15-3 expressed in units/mL and NSE expressed in µg/mL. X-axis denotes time point, baseline, 1 or 2 months after afatinib treatment. Y-axis denotes serum levels of biomarker.
Abbreviations: CEA, carcinoembryonic antigen; NSE, neuron-specific enolase.