Figures & data
Figure 1 miR-937 was associated with survival rate and regulated cell viability in breast cancer cells. (A) Heatmap of 86 genes differentially expressed in breast cancer from TCGA database; (B) volcano plot of 67 genes was significantly up-regulated and Volcano plot of 67 genes was significantly down-regulated; (C) miR-937 was significantly associated with survival rate in patients with breast cancer; (D) miR-937 highly expressed in breast cancer cell lines by RT-PCR analysis (E and F) the mRNA expression of miR-937 in MCF7 cells transfection with mimics/inhibitors/negative control was detected by RT-PCR analysis. β-actin was used as a load control. Data are presented as the mean ± standard deviation. ap<0.05 versus Blank group, bp<0.05 versus mimics/inhibitors group.
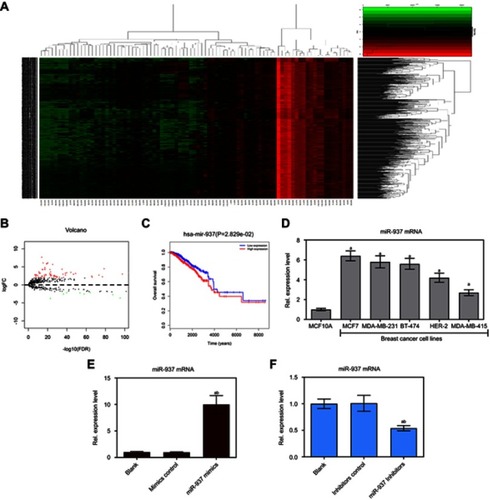
Figure 2 Effect of up-regulated miR-937 on apoptosis and proliferation. (A) The cell viability was detected by CCK8 assay in MCF7 cells transfection with mimics and their negative control; (B and C) the caspase-3/9 activities measured using biochemical analysis in MCF7 cells transfection with mimics/negative control; (D and E) cell cycle was estimated by flow cytometry assay in MCF7 cells transfection with mimics and negative control; (F and G) cell apoptosis was detected by flow cytometry assay in MCF7 cells transfection with mimics/negative control; (H and I) colony formation was used to detect the ability of cell proliferation in MCF7 cells transfection with mimics/negative control. Data are presented as the mean ± standard deviation. ap<0.05 versus blank group, bp<0.05 versus mimics group.
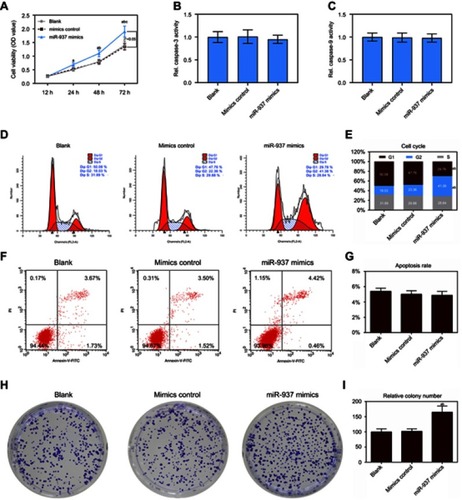
Figure 3 Effect of down-regulated miR-937 on apoptosis and proliferation. (A) The cell viability was detected by CCK8 assay in MCF7 cells transfection with inhibitors and their negative control; (B and C) the caspase-3/9 activities measured using biochemical analysis in MCF7 cells transfection with inhibitors/negative control; (D and E) cell cycle was estimated by flow cytometry assay in MCF7 cells transfection with inhibitors/negative control; (F and G) cell apoptosis was detected by flow cytometry assay in MCF7 cells transfection with inhibitors/negative control; (H and I) colony formation was used to detect the ability of cell proliferation in MCF7 cells transfection with inhibitors/negative control. Data are presented as the mean ± standard deviation. ap<0.05 versus blank group, bp<0.05 versus inhibitors group.
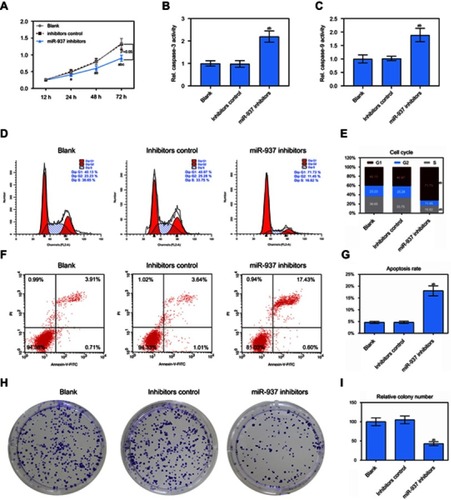
Figure 4 The target genes of miR-937 were predicted by miRDB and TargetScan databases and functional annotation. (A) Venn of 200 overlapping 3415 target genes and 212 target genes in the two databases (miRDB and TargetScan); (B and C) GO annotations analysis revealed that these target transcripts were implicated in a broad range of biological processes, cell component and molecular function; (D–F) APAF1 lowly expressed in breast cancer cell lines by RT-PCR and Western blot assays; (G–I) dual lucfierase report system to detect the effect of miR-937 on APAF1. β-actin was used as a load control. Data are presented as the mean ± standard deviation. ap<0.05 versus MCF10A cells group.
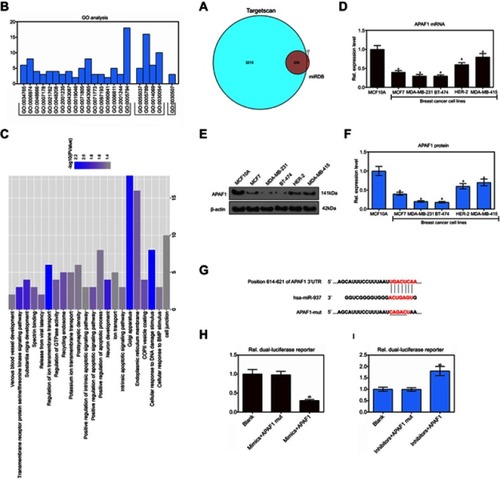
Figure 5 miR-937 significantly regulated the expression level of APAF1 gene. (A and B) The mRNA and protein expression level of APAF1 gene were detected by RT-PCR and Western blot assays after MCF7 cells transfection with miR-937 mimics/negative control; (C and D) the mRNA and protein expression level of APAF1 gene were detected by RT-PCR and Western blot assays after MCF7 cells transfection with miR-937 inhibitors/negative control; (E and F) RT-PCR and Western blot assays were used to dectect the transfection efficiency. β-actin was used as a load control. Data are presented as the mean ± standard deviation. ap<0.05 versus blank group/or control group, bp<0.05 versus mimics/inhibitors group/or NC group.
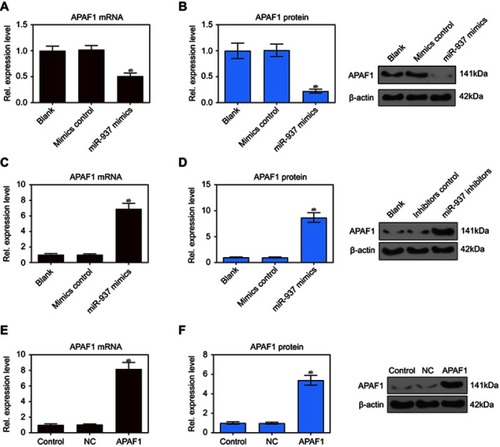
Figure 6 Up-regulation of APAF1 regulated cell proliferation and apoptosis in MCF7 cells. (A) The cell viability was detected by CCK8 assay in MCF7 cells transfection with APAF1 and negative control; (B and C) the caspase-3/9 activities measured using biochemical analysis in MCF7 cells transfection with APAF1/negative control; (D and E) cell cycle was estimated by flow cytometry assay in MCF7 cells transfection with APAF1/negative control; (F and G) cell apoptosis was detected by flow cytometry assay in MCF7 cells transfection with APAF1/negative control; (H and I) colony formation was used to detect the ability of cell proliferation in MCF7 cells transfection with APAF1/negative control. Data are presented as the mean ± standard deviation. ap<0.05 versus control group, bp<0.05 versus NC group.
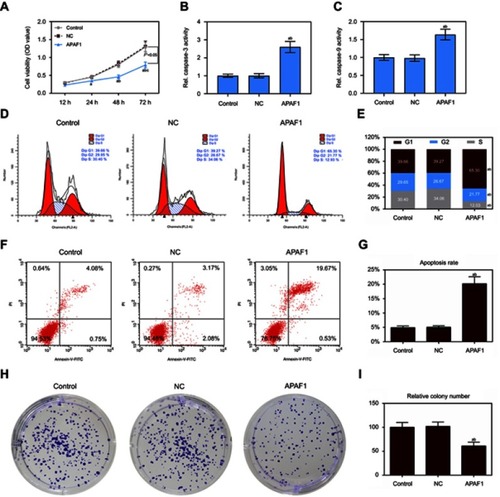
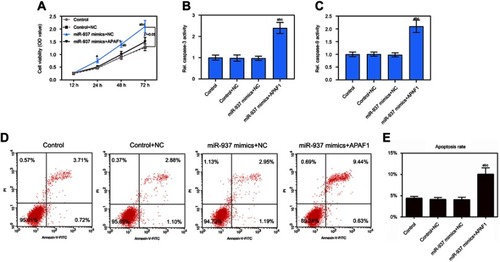
Figure 7 miR-937 regulated cell proliferation and apoptosis by targeting APAF1 gene. (A) The cell viability was detected by CCK8 assay in MCF7 cells co-transfection with miR-937 mimics and APAF1; (B and C) the caspase-3/9 activities measured using biochemical analysis in MCF7 cells co-transfection with miR-937 mimics and APAF1; (D and E) cell apoptosis was detected by flow cytometry assay in MCF7 cells transfection with inhibitors/negative control. Data are presented as the mean ± standard deviation. ap<0.05 versus control group, bp<0.05 versus control+NC group, cp<0.05 versus miR-937 mimics + NC group.