Figures & data
Figure 1 PKC-iota is associated with GLUT1 and SUVmax in primary NSCLC. (A, B) Images of 18F-PET/CT scanning, H/E staining, PKC-iota staining, and GLUT1 staining of primary NSCLC tissues of a patient (A) with relatively low 18F-FDG uptake (SUVmax =3.59) and low PKC-iota and GLUT1 co-expression (scale bar: 25 μm) and another patient (B) with relatively high 18F-FDG uptake (SUVmax =16.47) and high PKC-iota and GLUT1 co-expression (scale bar: 25 μm). (C) NSCLC tissues with high PKC-iota expression (10.07±1.09) accumulated much more 18F-FDG than tissues with low PKC-iota expression (5.28±1.28). (D) NSCLC tissues with high PKC-iota expression (5.03±0.41) expressed much more GLUT1 than tissues with low PKC-iota expression (3.75±0.40). (E) ROC curve analysis of SUVmax for predicting high PKC-iota expression. With a SUVmax cutoff value of 8.38, the sensitivity and specificity for high PKC-iota expression prediction were 62.07% and 87.50%, respectively (P=0.005; area under the ROC curve: 0.757; 95% confidence interval: 59.11% to 89.21%).
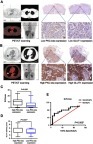
Figure 2 PKC-iota knockdown reduces 18F-FDG uptake and GLUT1 expression. (A) A549 and H1650 cells were transfected with Si NC or Si PKC-iota for 72 h, after which time 18F-FDG uptake of the indicated cells was detected (CPM: counts per minute). (B) A549 and H1650 cells were transfected with Si NC or Si PKC-iota for 72 h, after which time lactic acid production of the indicated cells was detected. (C) A549 and H1650 cells were transfected with Si NC or Si PKC-iota for 72 h. Then, the cell lysates were immunoblotted with antibodies against PKC-iota and GLUT1. β-Actin served as the loading control. (D) A549 and H1650 cells were transfected with Si NC or Si PKC-iota for 36 h. The mRNA levels of SLC2A1 were analyzed by real-time PCR. (E) A549 cells were transfected with Si NC or Si PKC-iota for 72 h before IF staining. Staining for DAPI (blue), GLUT1 (green), Na/K-ATPase α1 (red) and the overlays of three channels (the membrane localization of GLUT1 are shown in yellow) are shown in the first, second, third, and fourth lines, respectively (scale bar, 25 μm).
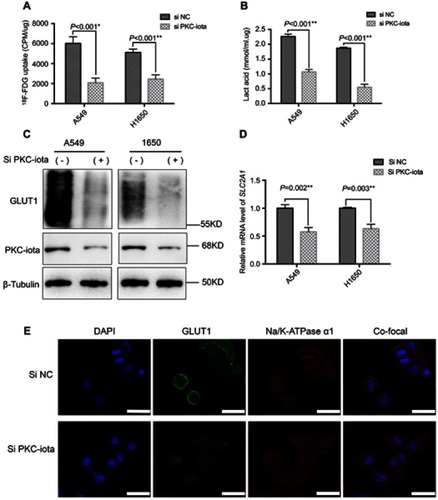
Figure 3 PKC-iota regulates GLUT1 via modulating c-Myc expression. (A) A549 cells were transfected with Si NC or Si PKC-iota for 36 h. The mRNA levels of the indicated genes were analyzed by real-time PCR. **means a P-value <0.005. (B) H1650 cells were co-transfected with Flag-PKC-iota (or empty vector) and Si c-Myc (or Si NC) for 72 h. Then, the cell lysates were immunoblotted with the indicated antibodies. β-Tubulin served as the loading control.
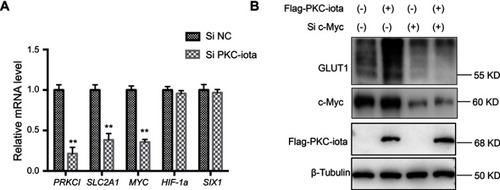
Figure 4 GLUT1 knockdown restrains PKC-iota-mediated 18F-FDG uptake and glycolysis. (A) H1650 cells were co-transfected with Flag-PKC-iota (or empty vector) and Si GLUT1 (or Si NC) for 72 h. Cell lysates were immunoblotted with antibodies against GLUT1 and Flag, whereas β-tubulin was used as the loading control. (B, C) H1650 cells were co-transfected with Flag-PKC-iota (or empty vector) and Si GLUT1 (or Si NC) for 72 h, and then intracellular 18F-FDG uptake (B) and lactification (C) were detected.
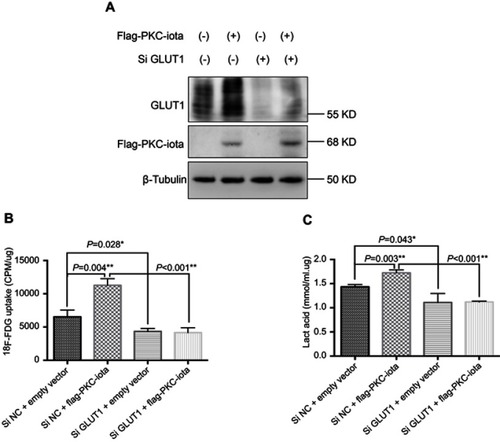
Figure 5 GLUT1 knockdown restrains PKC-iota-mediated growth of NSCLC cells. (A) After co-transfection with Flag-PKC-iota (or empty vector) and Si GLUT1 (or Si NC), the numbers of H1650 cells were counted at 24, 48, and 72 h. (B, C) H1650 cells were co-transfected with Flag-PKC-iota (or empty vector) and Si GLUT1 (or Si NC) for 36 h, after which time the cells were harvested to determine the migration and invasion capabilities by the wound-healing assay (left of (B) images of the indicated cells, scale bar: 25 μm; right of (B) statistical analysis of the migratory ability of the indicated cells) and transwell migration assay (left of (C) images of the indicated cells, scale bar: 25 μm; right of (C) statistical analysis of the invasive ability of the indicated cells), respectively.
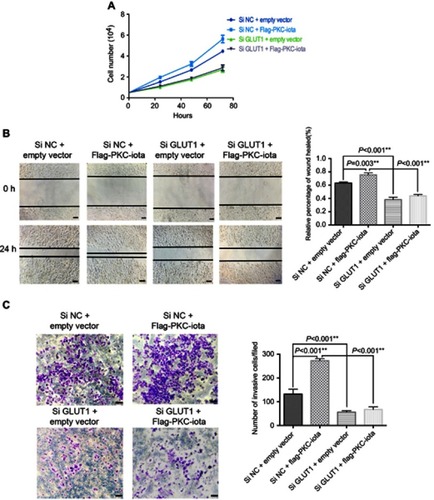
Table 1 Correlation of PKC-iota and GLUT1 expression in 81 primary NSCLC tumor tissues with different clinicopathological parameters
Figure 6 High PKC-iota and GLUT1 co-expression is related to poor NSCLC prognosis. Kaplan–Meier analysis of overall survival as a function of PKC-iota and GLUT1 levels in NSCLC tumor tissues.
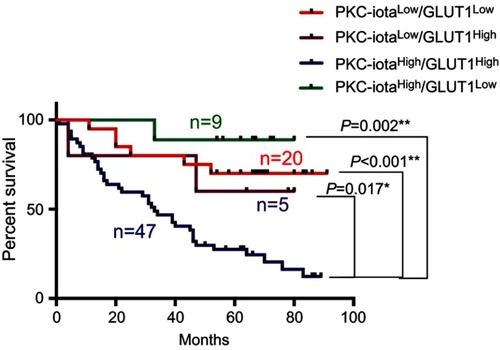
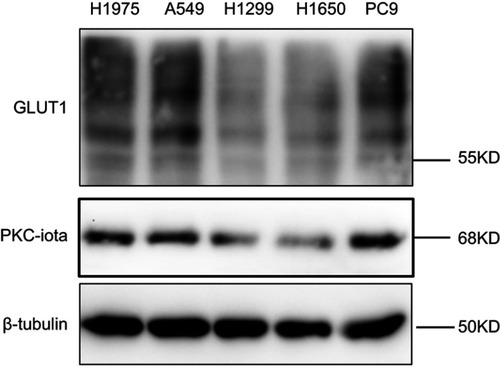
Figure S1 The basal protein levels of GLUT1 and PKC-iota in NSCLC cell lines. NSCLC cells lysates were immunoblotted with indicated antibodies. β-Tubulin served as the loading control