
Figures & data
Table 1 Physical examination findings in the population of recruited patients
Figure 1 (A) Quantitative distribution of subjects in four different age groups. (B) Proportion of Ultrasound results (−) and Ultrasound results (+) subjects in four different age groups.
Notes: Ultrasound (−) defined as normal prostate size, without any positive manifestations including prostate nodules, bilateral asymmetry of the outer glands, increased blood flow signals in the glands, unclear boundaries between the inner and outer glands, abnormal morphology; Ultrasound (+) defined as oversize prostate, or with manifestations including inflammatory change, prostate nodules, bilateral asymmetry of the outer glands, increased blood flow signals in the glands, unclear boundaries between the inner and outer glands, abnormal morphology.
Abbreviation: tPSA, total prostate-specific antigen.
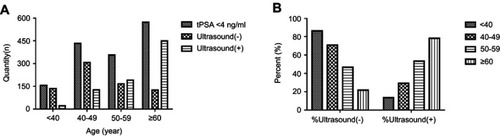
Table 2 Mean, standard deviation (SD) of the mean, and selected percentiles for PSA tests in healthy men of various ages
Figure 2 Serum levels of (A) tPSA, (B) fPSA, (C) %fPSA, (D) p2PSA, (E) %p2PSA and (F) phi in healthy males among the four different age groups. Boxes and horizontal lines indicate interquartile ranges and medians, respectively; whiskers stretch from the 2.5th to 97.5th percentiles for each age group.Notes: *indicates p<0.05; **indicates p<0.01; ***indicates p<0.001.
Abbreviations: tPSA, total prostate-specific antigen; fPSA, free prostate-specific antigen; p2PSA, [−2]proPSA; phi, prostate health index.
![Figure 2 Serum levels of (A) tPSA, (B) fPSA, (C) %fPSA, (D) p2PSA, (E) %p2PSA and (F) phi in healthy males among the four different age groups. Boxes and horizontal lines indicate interquartile ranges and medians, respectively; whiskers stretch from the 2.5th to 97.5th percentiles for each age group.Notes: *indicates p<0.05; **indicates p<0.01; ***indicates p<0.001.Abbreviations: tPSA, total prostate-specific antigen; fPSA, free prostate-specific antigen; p2PSA, [−2]proPSA; phi, prostate health index.](/cms/asset/07bbe948-a552-4b9b-9ff6-8fbe97e1de62/dott_a_12193301_f0002_c.jpg)
Figure 3 The age-related distribution curves of PSA (A), p2PSA and phi (B). Dots, squares and triangles indicate medians, respectively; whiskers stretch from the −95% confidence interval (CI) to the 95% CI for each age group.
Abbreviations: tPSA, total prostate-specific antigen; fPSA, free prostate-specific antigen; p2PSA, [−2]proPSA; phi, prostate health index.
![Figure 3 The age-related distribution curves of PSA (A), p2PSA and phi (B). Dots, squares and triangles indicate medians, respectively; whiskers stretch from the −95% confidence interval (CI) to the 95% CI for each age group.Abbreviations: tPSA, total prostate-specific antigen; fPSA, free prostate-specific antigen; p2PSA, [−2]proPSA; phi, prostate health index.](/cms/asset/b284ff0b-e440-4287-a076-dbecaa958c5b/dott_a_12193301_f0003_c.jpg)
Table 3 Reference intervals for p2PSA, % p2PSA and phi