
Figures & data
Table 1 Patients characteristics
Table 2 Baseline of patients’ characteristics
Figure 3 Survival curve of PFS and OS after apatinib treatment. (A. PFS; B. OS).
Abbreviations: PFS, progression-free survival; OS, overall survival.
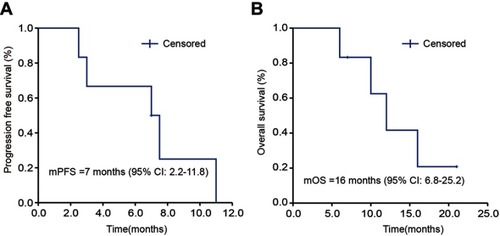
Figure 1 Waterfall plot for the best percentage change in target lesion size. Abbreviations: PD, progression disease; PR, partial response.
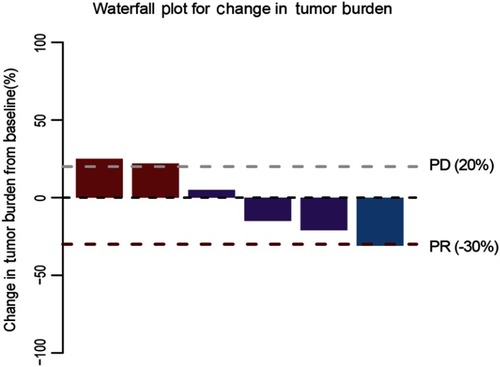
Figure 2 The CT scan of the cervical cancer patient.
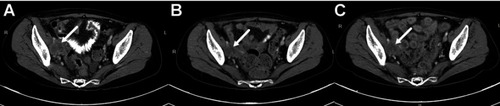
Table 3 Adverse events on treatment (n=6 evaluable patients)
Table 4 Clinic reports of anti-VEFGR in cervical cancer