Figures & data
Table 1 Primers of qRT-PCR Genes
Figure 1 The expressions of NEAT1 and miR-let-7b in HCC tissues/cell lines. (A) The relative expression of NEAT1 in HCC tissues (n=25) and adjacent non-tumor tissues (n=25, GAPDH as an internal normalizer). (B) The relative expression of NEAT1 in cells (HepG2, SMMC, Bel-7402, Huh-7 and L02). (C) The linear regression analysis of the expressions of NEAT1 and miR-let-7b (U6 as an internal normalizer) in HCC tissues (n=25). (D) The relative expression of miR-let-7b in cells. *P <0.05.
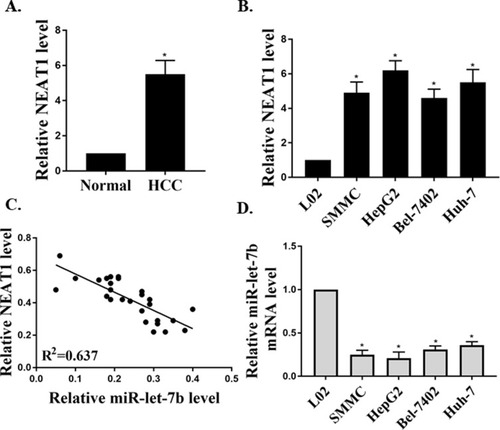
Figure 2 Effect of interfering with NEAT1 expression on tumor growth. (A) Effect of NEAT1 silencing on tumor growth in mice. (B) Effect of NEAT1 over-expression on tumor growth in mice. (C) Immunohistochemical staining of Ki-67. *P <0.05, **P <0.05.
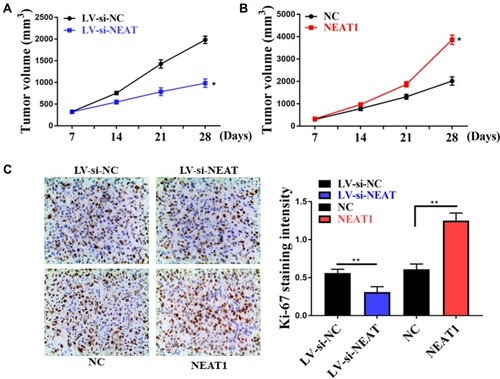
Figure 3 Effect of NEAT1 expression on the proliferation and apoptosis of HepG2/Huh7 cells. (A) Detection of NEAT1 expression in HepG2/Huh7 cells by qRT-PCR. (B) Effect of NEAT1 expression on the proliferation of HepG2/Huh7 cells. (C) The TUNEL (terminal deoxynucleotidyl transferase dUTP nickend labeling) and EDU labeling of HepG2/Huh7 cells. (D) Effect of NEAT1 expression on the percentage of TUNEL positive cells. (E) Effect of NEAT1 expression on the percentage of EDU positive cells. **P <0.05.
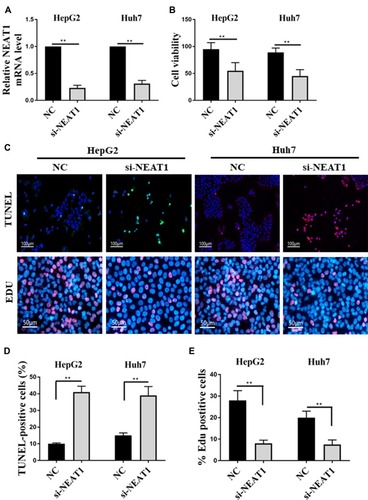
Figure 4 Role of let-7b on NEAT1-induced the proliferation in HCC cells. (A) Bioinformatic analysis showed the common binding sequence between let-7b and NEAT1. (B) Effect of Let-7b expression on the luciferase activity in HEK293 cells transfected with NEAT1 or shNEAT1. (C) Detection of the mRNA levels of let-7b in HepG2 and Huh7 cells by qRT-PCR. (D) Detection of the cell viability of HepG2 and Huh7 cells. (E) Effect of let-7b expression on the percentage of TUNEL positive cells. (F) Effect of let-7b expression on the percentage of EDU positive cells. *P <0.05 vs control in HepG2, #P <0.05 vs control in Huh7, **P <0.05.
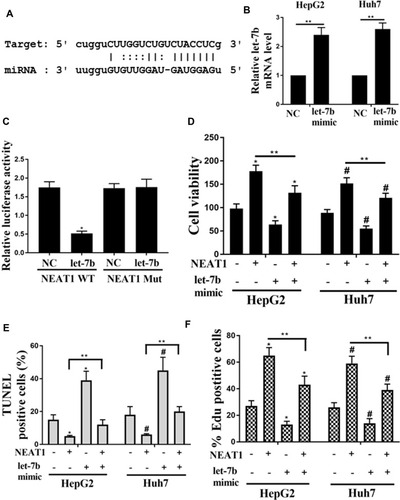
Figure 5 Identification of IGF-1R as a let-7b target binding site. (A) Bioinformatic analysis showed the common binding sequence between IGF-1R and let-7b. (B) Detection of the mRNA expression of IGF-1R in the HepG2 and Huh7 cells. (C) Analysis of the relative luciferase activity in HEK-293T cells co-transfected with et-7b precursors and IGF-1R WT. (D) Detection of the protein expression of IGF-1R in HCC cells by Western blot. *P <0.05 vs control in HepG2, #P <0.05 vs control in Huh7, **P <0.05.
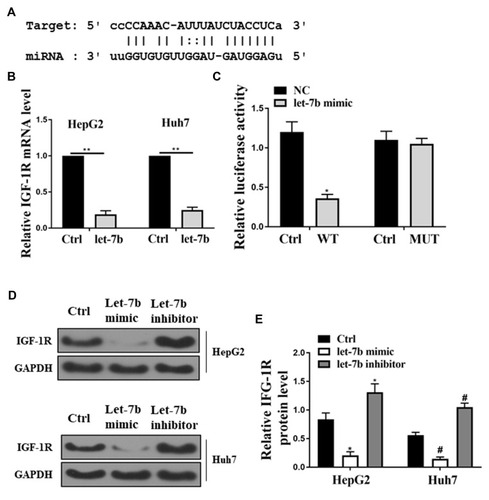
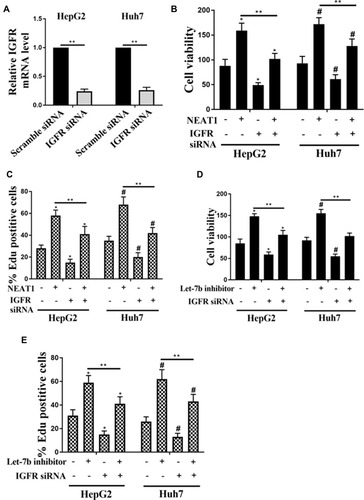
Figure 6 Role of IGF-1R on NEAT1- and let-7b-induced the cell viability and proliferation in HCC cells. (A) Detection of mRNA expression of IGF-1R in HepG2 and Huh7 cells transfected with scramble siRNA or IGF-1R siRNA by qRT-PCR. The cell viability (B) and the percentage of EDU positive cells (C) of HepG2 and Huh7 cells transfected with NEAT1 or IGF-1R siRNA alone or co-transfection NEAT1 and IGF-1R siRNA. The cell viability (D) and the percentage of EDU positive cells (E) of HepG2 and Huh7 cells transfected with let-7b inhibitor or IGF-1R siRNA alone or co-transfection with let-7b inhibitor and IGF-1R siRNA. *P <0.05 vs control in HepG2, #P <0.05 vs control in Huh7, **P <0.05.