Figures & data
Figure 1 Differential sensitivity of human Ovarian Cancer cell lines to JQ1. (A-F) OC cell lines A2780, HO-8910, SKOV-3, and HEY were incubated with different concentrations of JQ1 for 48 h. (A) After treatment, OC cell proliferation was measured by MTT assay. IC50 values were calculated by GraphPad Prism version, 7.0 software. (B and C) Annexin V and PI staining and flow cytometric analysis of the fraction of apoptotic cells in OC cell lines. (D) After treatment of OC cell lines with 2.5 μM JQ1 for 48 h, cell lysates were analysed for c-Myc and BRD4 expression by Western blotting. GAPDH was used as a protein loading control. (E and F) The relative expression of c-Myc and BRD4 were calculated by ImageJ software. P < 0.05 vs control group.
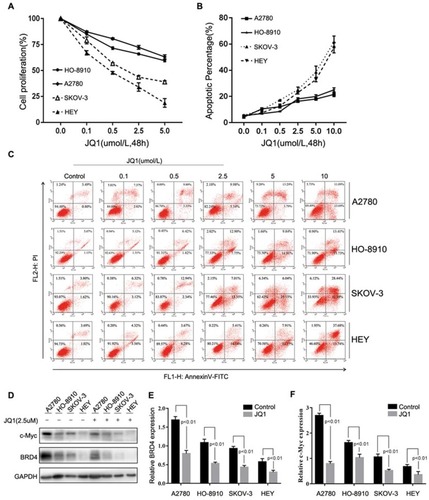
Figure 2 JQ1-induced autophagy in the resistant group. (A) After treatment of A2780, HO-8910, SKOV-3, and HEY cells with 2.5 μM JQ1 for 24 h, cell lysates were subjected to Western blotting for LC3-I/II expression. GAPDH was used as a protein loading control. Relative expression of LC3- II was detected by ImageJ software. P < 0.05 vs control group. (B) Ovarian Cancer cell lines were incubated with increased concentrations of JQ1 for 48 h, and cell lysates were subjected to Western blotting using antibodies against the indicated molecules. (C) Immunofluorescence staining of the endogenous expression of LC3B in A2780 and HO-8910 cells after treatment with 2.5 μM JQ1 for 48 h. Confocal images were obtained of the immunofluorescent LC3B (red) and nuclei stained with DAPI (blue). (magnification 60×oil). LC3 dots in each cell were enumerated in at least three distinct visual fields. P < 0.05 vs control group. (D) Cells were treated with DMSO or JQ1 (2.5 μM) for 48 h and stained by acridine orange to observe the formation of acidic vesicle organelles (AVO). P < 0.05 vs control group. (E) After treatment with JQ1 (2.5 μM) and CQ (5 μM), expression of LC3-I/II was detected by Western blotting.
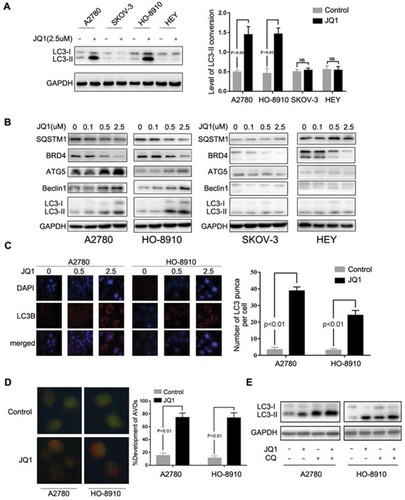
Figure 3 Inhibition of JQ1-induced autophagy enhances anti-proliferative activities and promotes cell apoptosis in resistant ovarian cancer cells. (A) A2780 and HO-8910 cells were treated with 2.5 μM JQ1, 5 μM 3-MA, or 5 μM CQ or a combination of JQ1 with 3-MA or CQ for 48 h, and measured the expression of the apoptosis marker cleaved PARP p85 and autophagy marker LC3-I/II. (B) A2780 and HO-8910 cells were plated in 6-well plates and treated with 2.5 μM JQ1, 5 μM 3-MA or 5 μM CQ, or a combination of both JQ1 and autophagy inhibitors for 14 days in a colony formation assay. (C) After co-treatment with increased concentrations of JQ1 and 5 μM 3-MA or 5 μM CQ, MTT assay was used to detect the anti-proliferation effect of JQ1 on resistant OC cells. IC50 was calculated by GraphPad Prism software. (D) A2780 and HO-8910 cells were treated with 2.5 μM JQ1, 5 μM 3-MA, or 5 μM CQ or a combination for 48 h and quantified for apoptosis by fluorescence-activated cell sorting (FACS) based on annexin V staining. P < 0.05 vs JQ1-alone treated group.
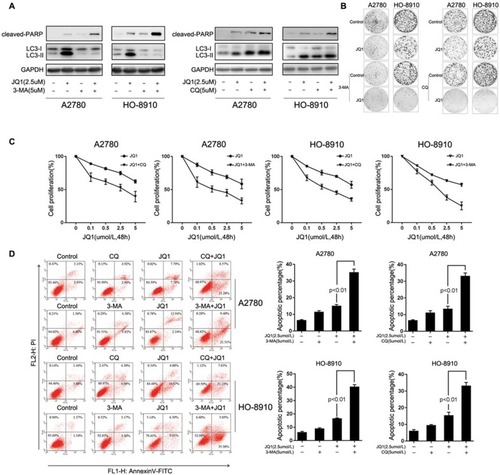
Figure 4 JQ1 induces autophagy through the inhibition of the Akt/mTOR pathway. (A) A2780 and HO-8910 cells were treated with the indicated concentration of JQ1 for 48 h. Cell lysates were used to detect Akt (S473), mTOR (S2448), P70S6K (S424/T421), and their phosphorylated counterparts by Western blot. (B and C) After treatment with 2.5 μM JQ1 in combination with transfection by Akt1 plasmid or control vector for 48 h. Immunofluorescence staining was used to detect the endogenous expression of LC3B, and Western blotting was used to identify the phosphorylated Akt (P-Akt), LC3- I, and LC3-II in A2780 and HO-8910 cells. *P < 0.05. (D) Cells were treated with or without JQ1 (2.5 μM) in combination with LY294002 (a PI3K/Akt inhibitor) for 48 h. Phosphorylated Akt (P-Akt), LC3- I, and LC3-II were detected by Western blot. P < 0.05 vs JQ1-alone treatment group. (E) Annexin V-FITC/PI staining were used to detect the level of apoptosis after treatment with JQ1 (2. μM) in combination with transfection by Akt1 plasmid or control vector for 48 h. P < 0.05 vs JQ1-alone treatment group.
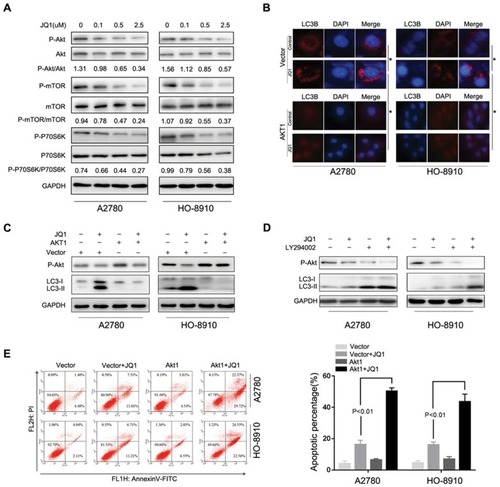
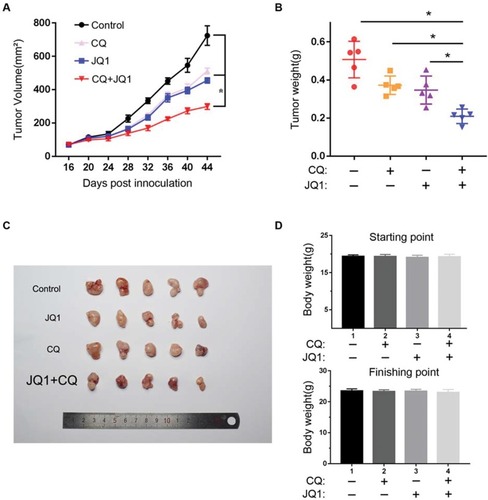
Figure 5 Autophagy inhibitor CQ synergises with BET inhibitor JQ1 in suppressing the growth of JQ1-resistant xenograft ovarian tumours in vivo. (A) A2780 cells were injected subcutaneously into the flank of NSG mice. The mice were randomised into four indicated treatment groups (n=5) after 2nd week and treated daily with vehicle control, 20 mg/kg JQ1, 80 mg/kg CQ, or in combination for 30 days. The tumour sizes were measured at the indicated time points. *P < 0.05. (B) Tumour weight was measured as a surrogate for tumour burden at the end of treatment. *P < 0.05. (C) Tumour mass images of A2780 model mice at day 45. P < 0.05 vs control group or JQ1-alone or CQ-alone treatment group. (D) Bodyweight of the mice from the indicated treatment groups at the starting and finishing points of the treatments. There is no statistical difference between the different treatment groups. Data are represented as mean with SEM (n = 5 mice/group).