Figures & data
Figure 1 JHC-4 induced the formation of cytoplasmic vacuoles. (A) The anti-proliferation effect of JHC-4 on BGC-823 cells was detected by MTT. (B) The anti-proliferation effect of JHC-4 on SGC-7901 cells was detected by MTT. (C) The morphology of BGC-823 cells was observed under an inverted light microscope, after treatment with 100 μg/mL of JHC-4 for 48 hrs. (D) The morphology of SGC-7901 cells was observed under an inverted light microscope, after treatment with 100 μg/mL of JHC-4 for 48 hrs. The data shown are representative of three unique experiments.
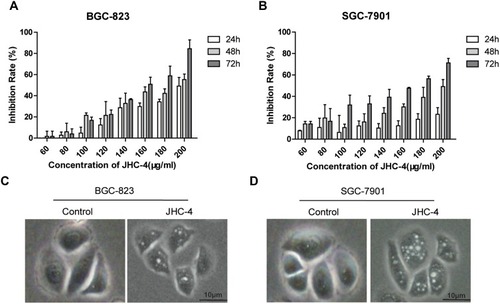
Figure 2 JHC-4 upregulated the protein levels of LC3-II in gastric cancer cells. (A) Autophagic vacuoles of gastric cancer cells were checked by MDC staining, after treatment with 100 μg/mL of JHC-4 for 48 hrs. (B) The level of LC3 in gastric cancer cells was detected by Western blot, after treatment with different concentrations of JHC-4 for 48 hrs. (C) The level of LC3 gastric cancer cells was detected by Western blot, after treatment with 50 μg/mL of JHC-4 for different time. The data are expressed as the mean±S.D. of three independent experiments. *Indicates a significant difference from control by Student’s t-test analysis. *P<0.05, **P<0.01, ***P<0.001.
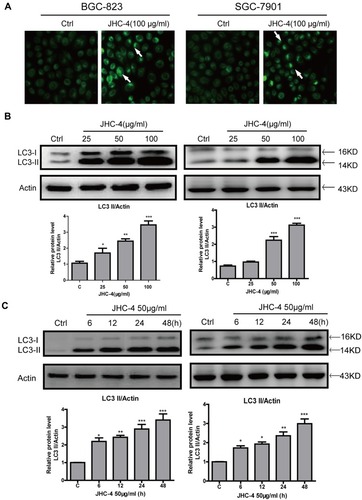
Figure 3 JHC-4 increased LC3-II after pretreatment with autophagic inhibitors. (A) The level of LC3 was detected by Western blot, after BGC-823 cells pretreated with 5 μM of CQ and treated with 50 μg/mL of JHC-4 for another 48 hrs. (B) The level of LC3 was detected by Western blot, after SGC-7901 cells pretreated with 5 μM of CQ and treated with 50 μg/mL of JHC-4 for another 48 hrs. (C) The level of LC3 was detected by Western blot, after BGC-823 cells pretreated with 100 nM of BafA1 and treated with 50 μg/mL of JHC-4 for another 48 hrs. (D) The level of LC3 was detected by Western blot, after SGC-7901 cells pretreated with 100 nM of BafA1 and treated with 50 μg/mL of JHC-4 for another 48 hrs. The data are expressed as the mean ± S.D. of three independent experiments. *Indicates a significant difference from control by Student’s t-test analysis, ***P<0.001.
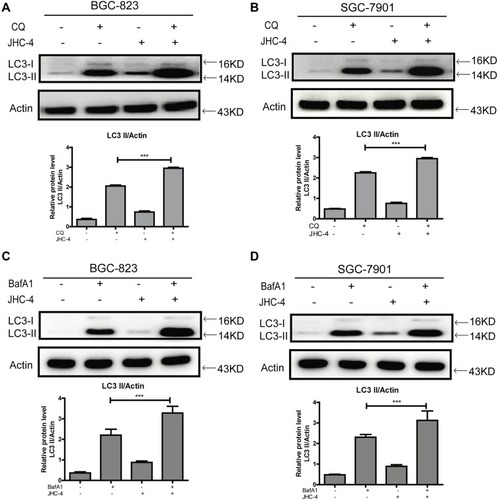
Figure 4 JHC-4 induced the accumulation of autophagosomes. (A) The expression of Atg-7 and Atg-3 in BGC-823 cells was determined by Western blot, after treatment with different concentrations of JHC-4 for 48 hrs. (B) The expression of Atg-7 and Atg-3 in SGC-7901 cells was determined by Western blot, after treatment with different concentrations of JHC-4 for 48 h. (C) The expression of Atg-7 and Atg-3 in BGC-823 cells was determined by Western blot, after treatment with 50 μg/mL of JHC-4 for different time. (D) The expression of Atg-7 and Atg-3 in SGC-7901 cells was determined by Western blot, after treatment with 50 μg/mL of JHC-4 for different time. The data are expressed as the mean ± S.D. of three independent experiments. *Indicates a significant difference from control by Student’s t-test analysis. *P<0.05, **P<0.01, ***P<0.001.
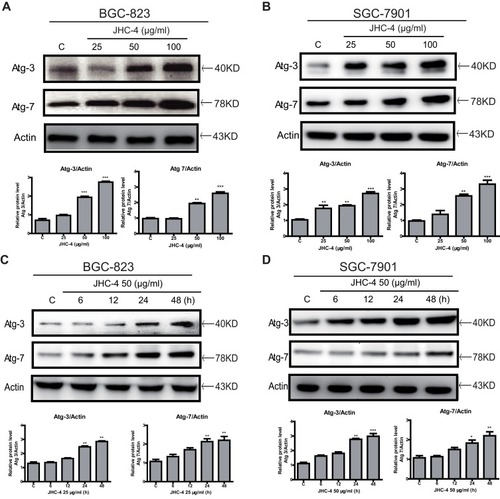
Table 1 Q-Value Assess the Combined Effect of JHC-4 and DDP on GC Cells
Table 2 Q-Value Assess the Combined Effect of JHC-4 and TPT on GC Cells
Table 3 Q-Value Assess the Combined Effect of JHC-4 and NVB on GC Cells
Table 4 Q-Value Assess the Combined Effect of JHC-4 and TAX on GC Cells
Table 5 Q-Value Assess the Combined Effect of JHC-4 and ADR on GC Cells
Table 6 Q-Value Assess the Combined Effect of JHC-4 and 5-FU on GC Cells
Figure 5 JHC-4 combined with TAX-induced apoptosis. (A) The synergistic anti-proliferation effect was detected by MTT, after treatment with 100 μg/mL of JHC-4 and indicated concentrations of TAX for 48 hrs. (B) The synergistic apoptosis effect was determined by flow cytometry analysis, after treatment with 100 μg/mL of JHC-4 and indicated concentrations of TAX for 48 hrs. (C) The expression of apoptosis-related proteins (PARP, cleaved PARP, caspase-9, and cleaved caspase-9) was checked by Western blot, after different treatments for 48 hrs. (D) The statistical result of PARP after different treatments. (E) The statistical result of cleaved PARP after different treatments. (F) The statistical result of caspase-9 after different treatments. (G) The statistical result of cleaved caspase-9 after different treatments. The data are expressed as the mean ± S.D. of three independent experiments. *Indicates a significant difference from control by Student’s t-test analysis. *P<0.05, **P<0.01, ***P<0.001.
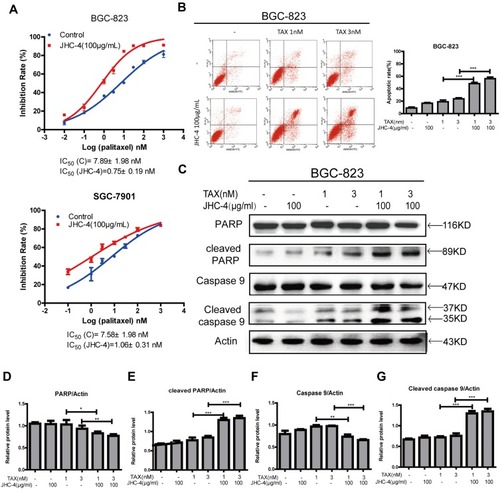
Figure 6 JHC-4 induced apoptosis through autophagy when combined with paclitaxel. (A) The expression of LC3 was checked by Western blot, after different treatments for 48 hrs. (B) The statistical result of LC3 after different treatments. (C) The synergistic anti-proliferation effect was detected by MTT, after BGC-823 cells pretreated with 100 nM of BafA1 and treated with 100 μg/mL of JHC-4 and indicated concentrations of TAX for another 48 hrs. (D) The apoptosis effect was determined by flow cytometry analysis, after different treatments for 48 hrs. (E) The expression of apoptosis-related proteins (PARP, cleaved PARP, caspase-9, and cleaved caspase-9) was checked by Western blot, after different treatments for 48 hrs. (F) The statistical result of apoptosis-related proteins (PARP, cleaved PARP, caspase-9, and cleaved caspase-9) after different treatments. The data are expressed as the mean ± S.D. of three independent experiments. *Indicates a significant difference from control by Student’s t-test analysis. **P<0.01, ***P<0.001.
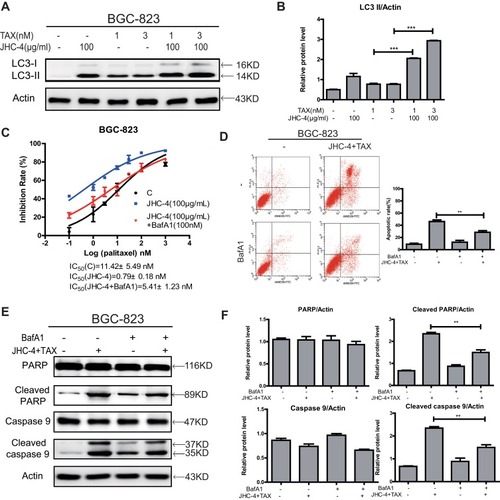
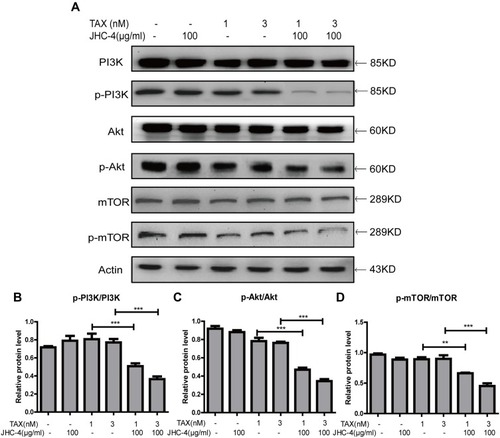
Figure 7 The PI3K/Akt/mTOR signaling pathway was inhibited by treatment with JHC-4 and TAX. (A) The expression of PI3K/Akt/mTOR related proteins was checked by Western blot, after different treatments for 48 hrs. (B) The statistical result of PI3K/Akt/mTOR related proteins after different treatments. The data are expressed as the mean ± S.D. of three independent experiments. *Indicates a significant difference from control by Student’s t-test analysis. **P<0.01, ***P<0.001.