Figures & data
Figure 1 Levels of FOXP4-AS1 in HCC and control groups, based on quantitative real-time PCR data.
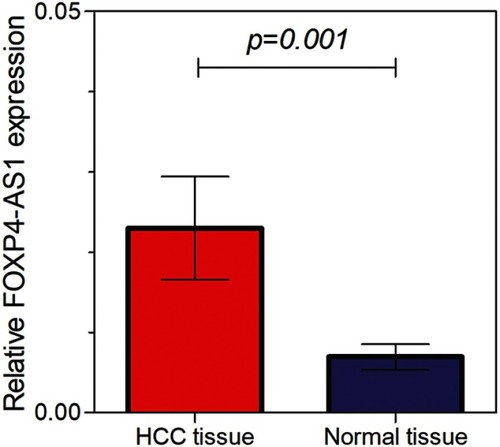
Figure 2 Kaplan-Meier curves for FOXP4-AS1 in HCC based on qRT-PCR. (A) Disease-free survivals of groups with low and high levels of FOXP4-AS1. (B) Overall survival of groups with low and high levels of FOXP4-AS1.
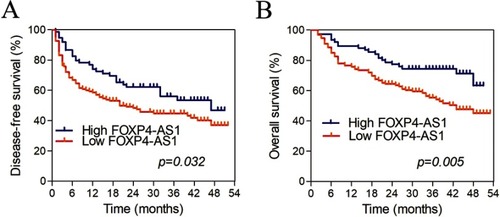
Figure 3 Venn diagram of DEmiRNAs of FOXP4-AS1.
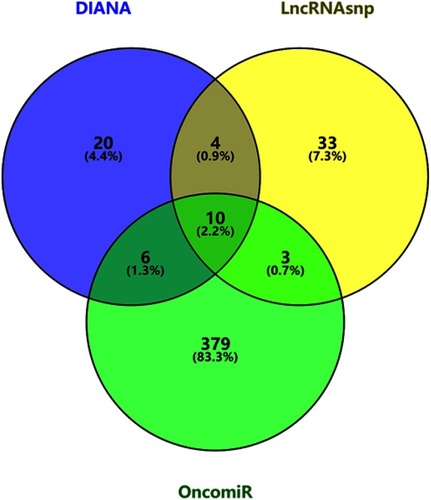
Figure 4 Venn diagram of target genes of FOXP4-AS1. (A) Upregulated target genes; (B) downregulated target genes.
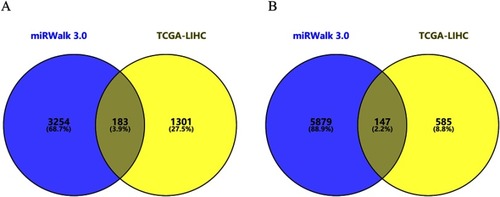
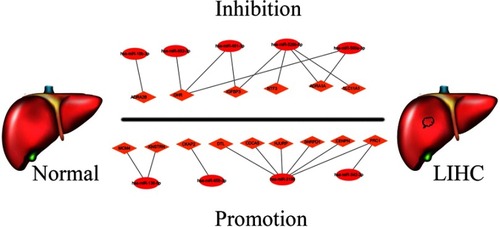
Figure 5 MiRNA-mRNA regulatory network of 6 upregulated miRNAs associated with FOXP4-AS1.
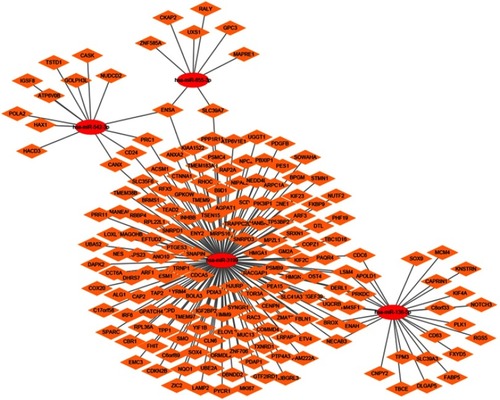
Figure 6 MiRNA-mRNA regulatory network of 4 downregulated miRNAs associated with FOXP4-AS1.
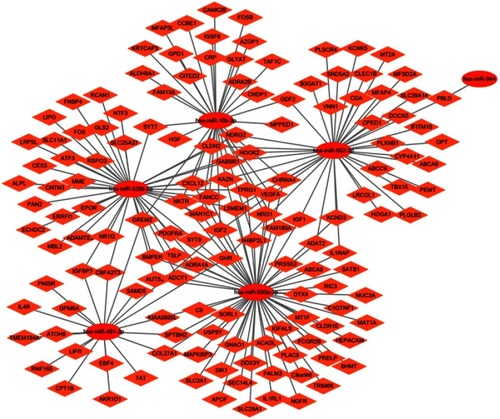
Figure 7 GO functional annotation and KEGG pathway analysis. Most prominent BP, CC, MF, and KEGG pathways associated with (A–D) upregulated and (E–H) downregulated candidate genes of FOXP4-AS1. (A, E) BP; (B, F) CC; (C, G) MF; and (D, H) KEGG pathways.
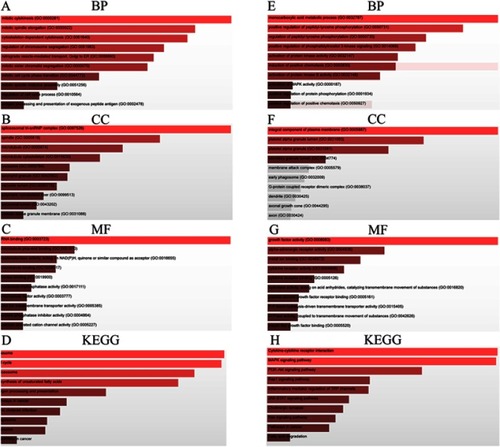
Figure 8 PPI network of upregulated target genes of FOXP4-AS1 in HCC.
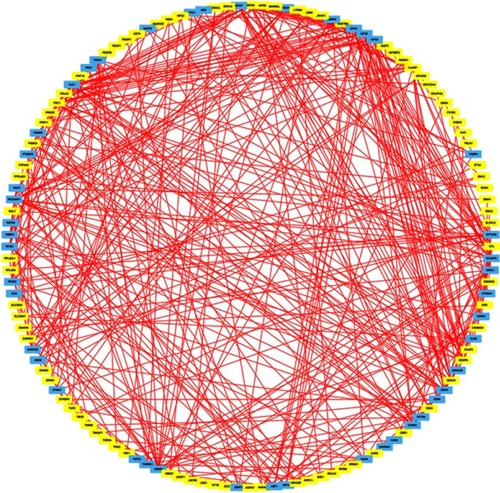
Figure 9 PPI network of downregulated target genes of FOXP4-AS1 in HCC.
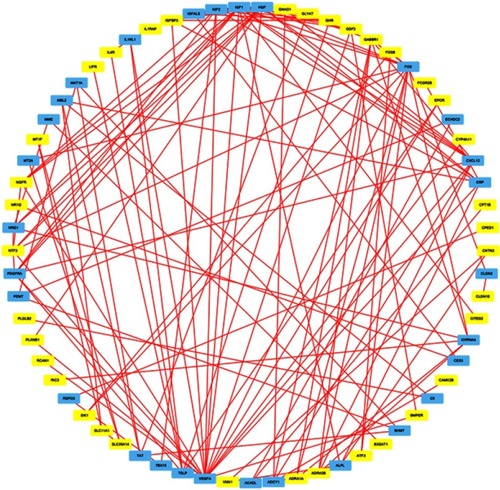
Figure 10 Expressions of 10 upregulated hub genes in HCC and normal tissues, based on GEPIA. (A) HJURP. (B) DTL. (C) CKAP2. (D) KNSTRN. (E) MCM4. (F) PRC1. (G) RPL36A. (H) SNRPD1. (I) CDCA5. (J) CENPN.
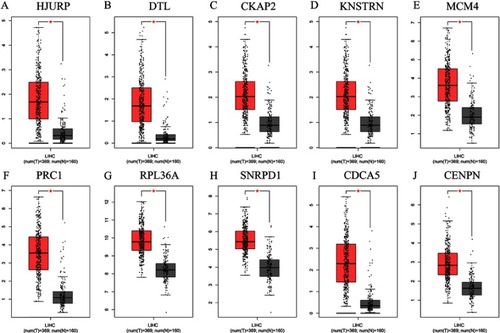
Figure 11 Expressions of 10 downregulated hub genes in HCC and normal tissues, based on GEPIA. (A) GHR. (B) FOSB. (C) ADRA2B. (D) ADRA1A. (E) SLC11A1. (F) NTF3. (G) NGFR. (H) IGFBP3. (I) CDF2. (J) GABBR1.
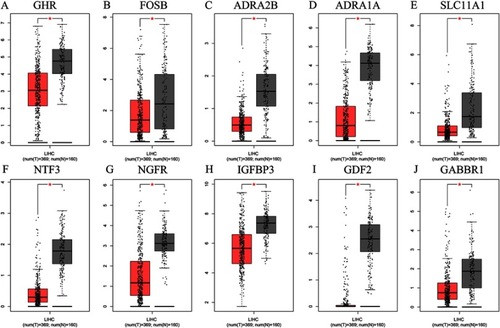
Figure 12 Association of expressions of 10 upregulated hub genes and the survival of patients with HCC. (A) CKAP2. (B) CENPN. (C) CDCA5. (D) SNRPD1. (E) RPL36A. (F) PRC1. (G) MCM4. (H) KNSTRN. (I) HJURP. (J) DTL.
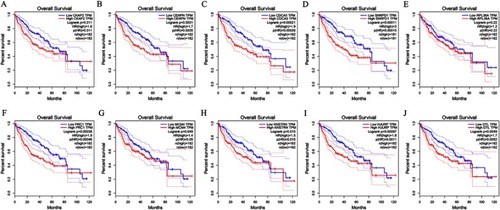
Figure 13 Association of expressions of 10 downregulated hub genes and survival of patients with HCC. (A) ADRA1A. (B) SLC11A1. (C) NTF3. (D) NGFR. (E) IGFBP3. (F) GHR. (G) GDF2. (H) GABBR1. (I) FOSB. (J) ADRA2B.
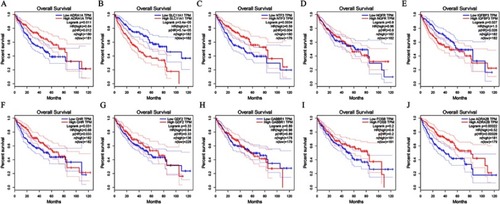
Figure 14 Network review of genes neighboring hub genes and genetic alteration of hub genes in HCC. (A) Ten upregulated hub genes. (B) Ten downregulated hub gene. (C) Genetic alteration of 10 upregulated hub genes. (D) Genetic alteration of 10 downregulated hub genes. Association between hub genes and drugs.
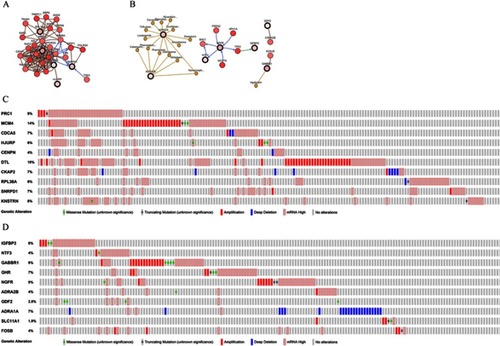
Figure 15 Enrichment analysis of the genes altered in the 20 hub neighboring genes in HCC. Most prominent BP, CC, MF, and KEGG pathways associated with (A–D) upregulated and (E–H) downregulated hub neighboring genes of FOXP4-AS1. (A, E) BP; (B, F) CC; (C, G) MF; and (D, H) KEGG pathways.
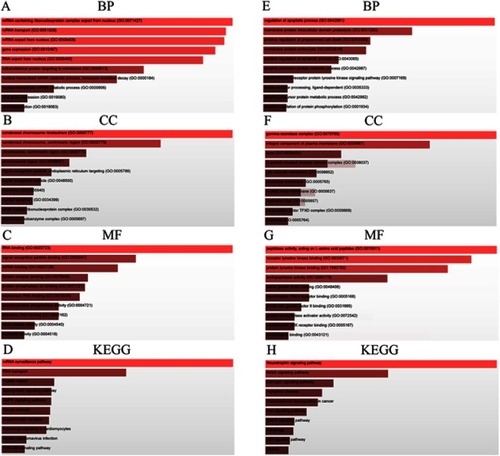
Figure 16 The candidate miRNA-hub gene regulatory network in HCC.