Figures & data
Figure 1 GDNB inhibits the growth of non-small cell lung cancer cells. WI-38, H510A and A549 cells were subjected to different concentrations of GDNB (0.25, 0.5, 1.5, 3 and 5 mg/mL) for 24 hrs, 48 hrs and 72 hrs, respectively. (A) Cell viability of WI-38 cells was measured by CCK8 assay. (B) Cell viability of H510A cells was measured by CCK8 assay. (C) Cell viability of A549 cells was measured by CCK8 assay. (D–G) A549and H510A cells were subjected to different concentrations of GDNB (0.25, 0.5 and 1 mg/mL) for 48 hrs. (D–E) Cell growth of A549 and H510A cells was measured by colony formation assay. (F–G) The protein levels of Ki67 and PCNA in H510A and A549 cells were measured by Western blotting. β-actin was used as internal reference. (*p < 0.05, **p <0.01, ***p < 0.001 vs control group).
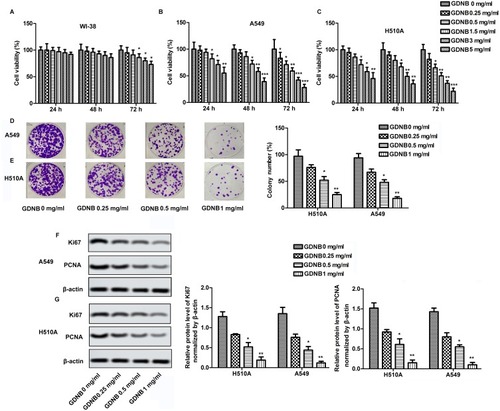
Figure 2 GDNB inhibits invasion, migration and EMT in non-small cell lung cancer cells. H510A and A549 cells were subjected to different concentrations of GDNB (0.25, 0.5 and 1 mg/mL) for 48 hrs. (A and B) Invasion of H510A and A549 cells was measured by Transwell assay. (C and D) Migration of H510A and A549 cells was measured by Wound healing assay. (E and F) Cell morphology was examined by microscopy during EMT process. (G) The protein levels of N-cadherin, E-cadherin, vimentin and Snail in H510A and A549 cells were measured by Western blotting. β-actin was used as internal reference. (*p < 0.05, **p <0.01 vs control group).
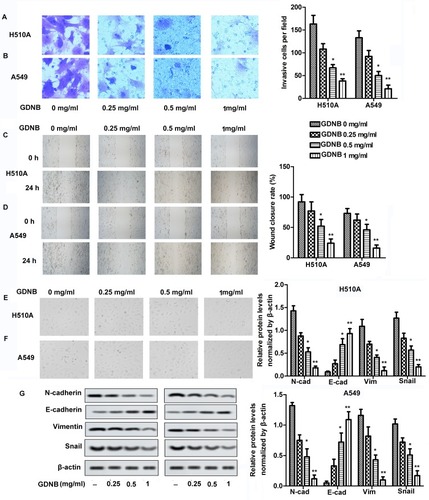
Figure 3 GDNB promotes apoptosis in non-small cell lung cancer cells. H510A and A549 cells were subjected to different concentrations of GDNB (0.25, 0.5 and 1 mg/mL) for 48 hrs. (A and B) Apoptotic rates of H510A and A549 cells were measured by flow cytometry analysis. (C and D) The protein levels of Bcl-2, Bax, cleaved caspase 3 and cleaved PARP in H510A and A549 cells were measured by Western blotting. β-actin was used as internal reference. (*p < 0.05, **p <0.01 vs control group).
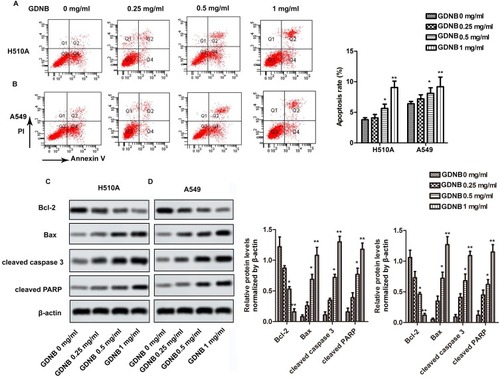
Figure 4 GDNB inhibits the development of non-small cell lung cancer by inactivating the ERK pathway. (A) A549 cells were subjected to different concentrations of GDNB (0.25, 0.5 and 1 mg/mL) for 48 hrs. The protein levels of Ras, c-Myc, MEK1/2, p-MEK1/2, ERK1/2 and p-ERK1/2 were measured by Western blotting. β-actin was used as internal reference. (*p < 0.05, **p <0.01 vs control group) (B–F) A549 cells were subjected to 1 mg/mL GDNB or/and Ceramide C6 (10 μM) for 48 hrs. (B) The protein levels of Ras, c-Myc, MEK1/2, p-MEK1/2, ERK1/2 and p-ERK1/2 were measured by Western blotting. β-actin was used as internal reference. (*p < 0.05, **p <0.01 vs control group; #p < 0.05 vs Ceramide C6 group) (C) Cell growth of H510A and A549 cells was measured by colony formation assay. (D) Apoptotic rate of A549 cells was measured by flow cytometry analysis. (E) Invasion of A549 cells was measured by Transwell assay. (F) Migration of A549 cells was measured by Wound healing assay. (*p < 0.05, **p < 0.01 vs control group; #p < 0.05 vs Ceramide C6 group).
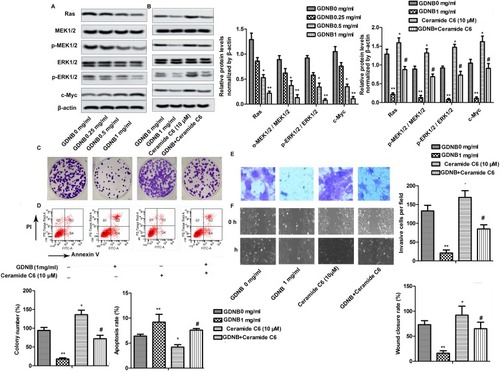
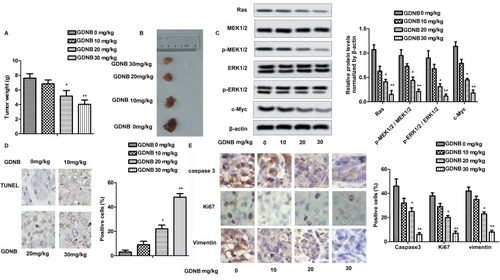
Figure 5 GDNB inhibits tumor formation in vivo through the ERK pathway. Lung tumor-bearing mice were randomly divided into 4 groups (ten in each group): Control group (0.9% saline) and Administration groups (10, 20, 30 mg/kg GDNB). (A) Tumor weight. (B) Tumor image. (C) The protein levels of Ras, c-Myc, MEK1/2, p-MEK1/2, ERK1/2 and p-ERK1/2 were measured by Western blotting. (D) The number of apoptotic tumor cells was detected by TUNEL assay. (E) The expression of caspase 3, ki67 and vimentin in tumor tissues was measured by IHC. (*p < 0.05, **p <0.01 vs control group).