Figures & data
Figure 1 Schematic of experimental steps.
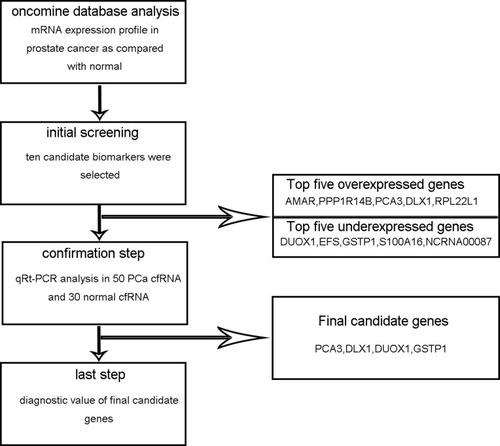
Table 1 Clinical Characteristics of Patients and Healthy Donors
Figure 2 Heat map of differentially expressed genes in PCa compared with normal controls. (A) Top 20 over-expressed genes (red). (B) Top 20 under-expressed genes (blue).
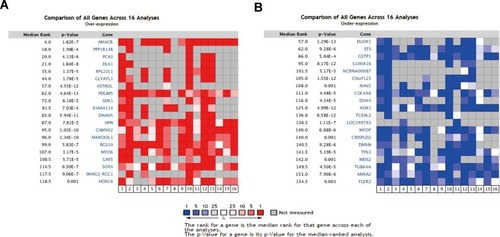
Figure 3 Clinical validation of candidate biomarkers of PCa. PCA3, DLX1, DUOX1, and GSTP1 plasma mRNA expression in PCa compared with normal controls (Top); corresponding ROC analysis of PCA3, DLX1, DUOX1, and GSTP1 plasma mRNA expression in PCa (Bottom). *P < 0.05, **P < 0.01 vs control.
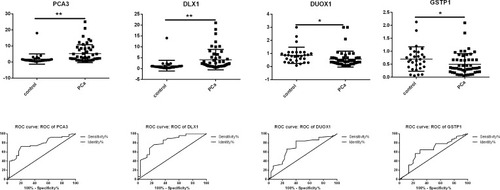
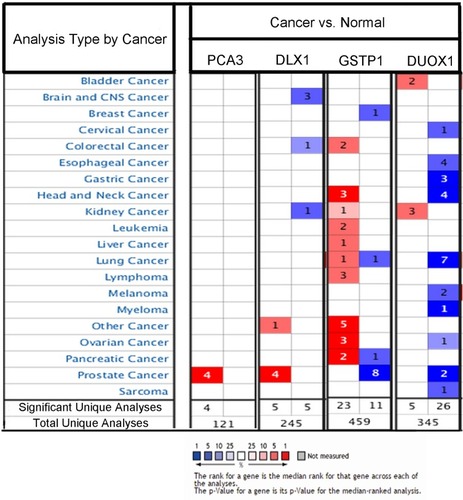
Figure 4 PCA3, DLX1, DUOX1, and GSTP1 expression in various cancers were analyzed. Red represents overexpression in various cancers compared with normal controls; blue represents underexpression in various cancers compared with normal controls.