Figures & data
Figure 1 The level of LINC00152 in ESCC tissues and cell lines. (A and C) qRT-PCR was performed to detect the level of LINC00152 in ESCC tissues and cell lines. (B) The interrelation between patients’ survival rate (log-rank test) and the level of LINC00152 was shown. *P<0.05.
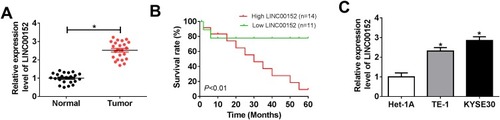
Figure 2 LINC00152 knockdown affected cell proliferation ability, migration ability and invasion ability in ESCC cells. (A, B) Three siRNAs targeting LINC00152 (si-LINC00152#1, si-LINC00152#2 and si-LINC00152#3) and si-NC was transfected into TE-1 and KYSE30 cells to examine the knockdown efficiency. (C–F) The TE-1 and KYSE30 cells were transfected with control, si-NC or si-LINC00152. (C, D) The cell proliferation ability was measured by CCK8 assay. (E, F) The migration and invasion abilities were evaluated via Transwell assay. *P<0.05.
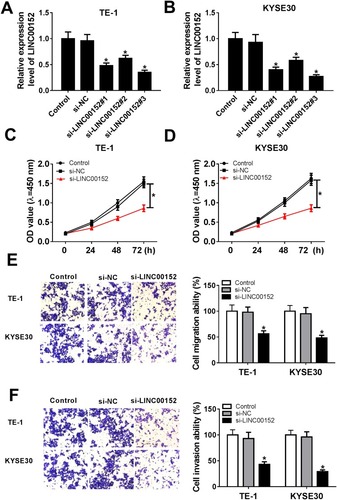
Figure 3 miR-107 was a target of LINC00152. (A) The putative complementary sequences between LINC00152 and miR-107 were predicted by starBase v2.0. (B, C) The luciferase activity of LINC00152 WT or LINC00152 MUT reporter was detected by dual-luciferase reporter assay. (D) RIP assay was performed to detect the enrichment of LINC00152 by Ago2 or IgG antibody in TE-1 and KYSE30 cells transfected with miR-107 mimic or miR-NC. (E, F) The level of miR-107 was detected in ESCC tissues and cells using qRT-PCR. (G) The level of miR-107 in si-LINC00152-transfected TE-1 and KYSE30 cells was tested by qRT-PCR. (H) The linear correlation between the level of LINC00152 and miR-107 was shown. *P<0.05.
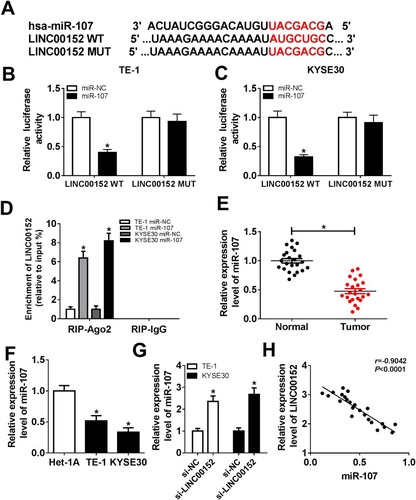
Figure 4 MiR-107 retarded cell proliferation, migration, and invasion in TE-1 and KYSE30 cells. (A–F) The TE-1 and KYSE30 cells were transfected with miR-NC, miR-107, in-miR-NC, or in-miR-107. (A, B) The level of miR-107 was tested by qRT-PCR. (C, D) The cell viability was monitored via CCK8 assay. (E, F) The migration and invasion were assessed by Transwell assay. *P<0.05.
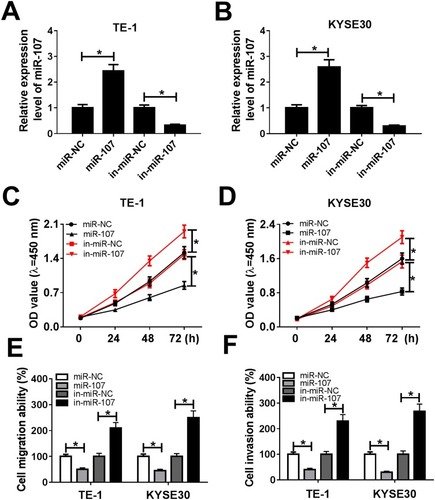
Figure 5 miR-107 attenuated the inhibitory effect on cell proliferation, migration and invasion induced by LINC00152 knockdown. (A–F) The TE-1 and KYSE30 cells were transfected with si-NC, si-LINC00152, si-LINC00152 + in-miR-NC or si-LINC00152 + in-miR-107. (A, B) The level of miR-107 was measured by qRT-PCR. (C, D) The cell viability was monitored via CCK8 assay. (E, F) The migration and invasion were assessed by Transwell assay. *P<0.05.
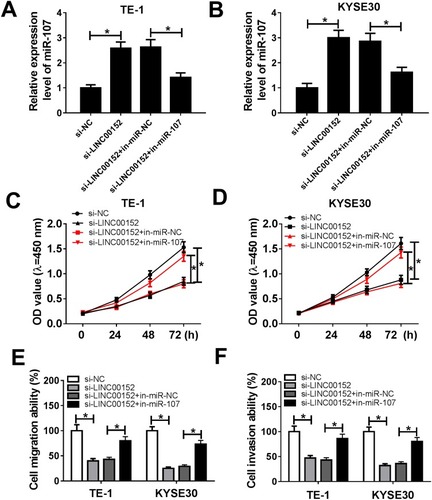
Figure 6 Rab10 directly interacted with miR-107 in ESCC. (A) The putative binding sites between miR-107 and Rab10 3ʹUTR were shown, as well as the mutant sequences. (B, C) The luciferase activity of Rab10 3ʹUTR-WT or Rab10 3ʹUTR-MUT reporter was detected by dual-luciferase reporter assay. (D–F) The mRNA and protein levels of Rab10 in ESCC tissues and cells were tested by qRT-PCR and Western blot assay. (G, H) The protein level of Rab10 in TE-1 and KYSE30 cells transfected with miR-107 (miR-NC) or si-LINC00152 (si-NC) was assessed by Western blot assay. (I and J) The correlation among the expression of Rab10, miR-107 and LINC00152 was shown. *P<0.05.
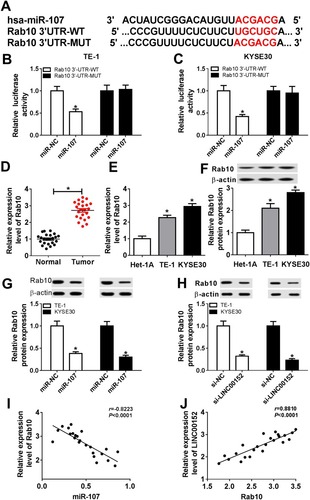
Figure 7 Rab10 accelerated cell proliferation, migration, and invasion in TE-1 and KYSE30 cells. (A–F) The TE-1 and KYSE30 cells were transfected with pcDNA, Rab10, si-NC, si-Rab10. (A, B) The level of miR-107 was tested by qRT-PCR. (C, D) The cell viability was monitored via CCK8 assay. (E, F) The migration and invasion abilities were assessed by Transwell assay. *P<0.05.
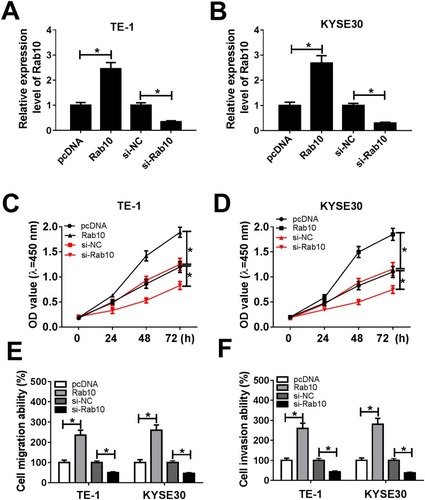
Figure 8 Rab10 counteracted the inhibitory effect on cell proliferation, migration and invasion in ESCC induced by miR-107 mimic. (A–F) The TE-1 and KYSE30 cells were transfected with miR-NC, miR-107, miR-107 + pcDNA or miR-107 + Rab10. (A, B) The level of Rab10 was measured by qRT-PCR. (C, D) The cell viability was monitored via CCK8 assay. (E, F) The migration ability and invasion ability were assessed by Transwell assay. *P<0.05.
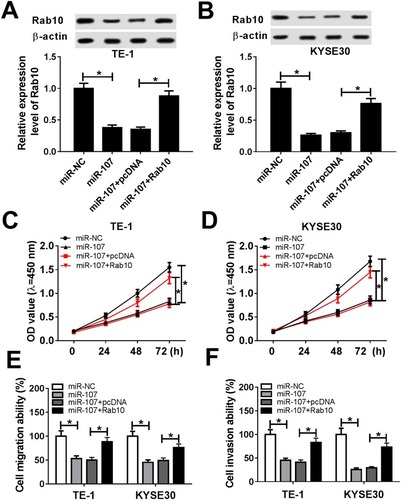
Figure 9 The level of Rab affected by LINC00152 and miR-107. (A, B) The TE-1 and KYSE30 cells were transfected with si-NC, si-LINC00152, si-LINC00152 + in-miR-NC or si-LINC00152 + in-miR-107. (A) The mRNA level of Rab10 was tested by qRT-PCR. (B) The protein level of Rab10 was examined via Western blot assay. *P<0.05.
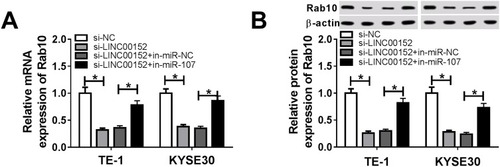
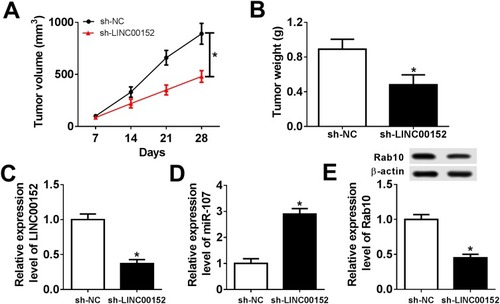
Figure 10 LINC00152 knockdown inhibited xenograft growth in vivo. (A–E) The nude mice were divided into sh-NC group and sh-LINC00152 group. (A, B) The xenograft volume and weight were exhibited. (C, D) The level of LINC00152 and miR-107 was detected by qRT-PCR. (E) The protein level of Rab10 was measured by Western blot assay. *P<0.05.