Figures & data
Figure 1 FISH detection of the two cell lines of MLL-rearranged acute leukemia. Arrow: positive signal cells (one red, one green, and one fusion signal), (A) THP-1 cells, (B) RS4:11 cells.
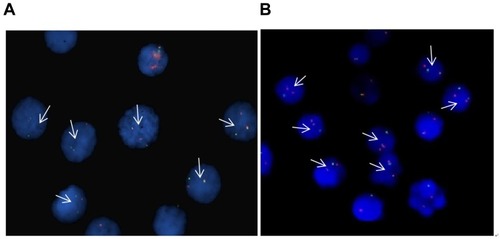
Figure 2 Detection of siRNA transfection efficiency. Transfection of the RS4:11 cells and the THP-1 cells with the plasmid resulted in an intracellular distribution of the green fluorescence. Upper: The green fluorescent proteins were observed under a fluorescence microscope to calculate the transfection rate (left: 95%, in RS4:11 cells; right: 91% of THP-1 cells). Lower figure: Detection of the transfer efficiency was observed by flow cytometry (left: 85% of RS4:11 cells, right: 89% of THP-1 cells).
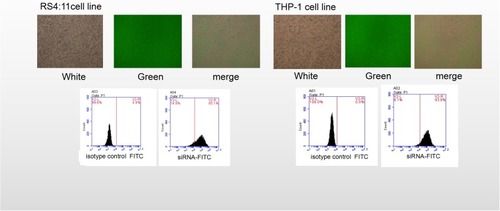
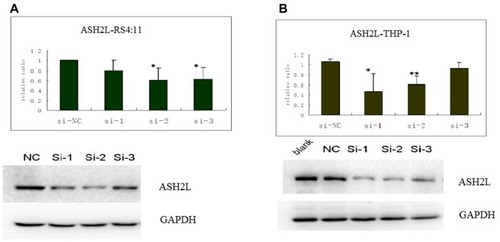
Figure 3 ASH2L levels were analyzed by Western blotting in RS4:11 and THP-1 cell lines after siRNA interference. The protein level of ASH2Lin sample No. 1 and 2 of THP-1 cells and sample No. 2 and 3 of RS4:11 cells were lower than that of the negative control group. (A) Expression in RS4:11 cells; (B) expression in THP-1 cells. Upper: column chart; Lower: electrophoresis map, ASH2L (Si-1: 741 bp, Si-1: 1412 bp, Si-1: 1664 bp). Western Blot Statistics (*P < 0.05, **P < 0.01).