Figures & data
Table 1 Correlation Of Clinico-Pathological Features With CLK3 Expression In ZZU HCC Cohort
Figure 1 CLK3 expression is upregulated in HCC tissues and high CLK3 expression indicates poor prognosis of patients with HCC. (A) CLK3 expression in 8 paired HCC tissues (T) and adjacent non-cancer tissues (N) was analyzed by Western blot. (B) Representative image of CLK3 IHC staining in HCC TMA cohort with different staining scores. Images were presented at ×40 magnification (up panel) or ×200 magnification (lower panel). (C) Representative CLK3 IHC staining results of HCC or paired adjacent normal tissues and the distribution of CLK3 IHC staining scores in HCC or paired adjacent normal tissues. Images were presented at ×40 magnification. (D) Representative images of CLK3 IHC staining and distribution of CLK3 IHC staining scores in HCC with different TNM stage, with or without lymph node metastasis. (E) Kaplan–Meier analysis of overall survival (OS) in HCC patients with high- or low-expression of CLK3 in ZZU TMA cohort. (F) Higher CLK3 expression was associated with Child-Pugh stage, present vascular invasion, advanced TNM stage, lager tumor size and poor survival state. **p < 0.01 based on the nonparametric test.
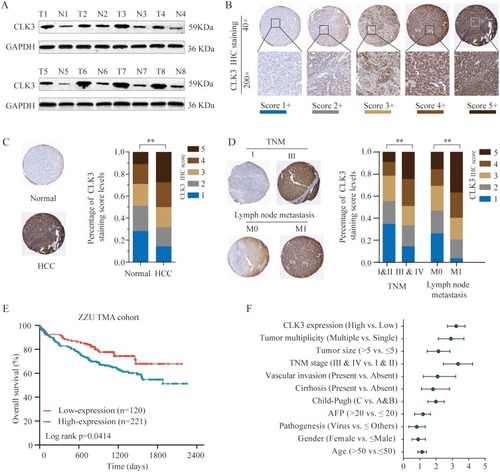
Table 2 Correlation Of Clinico-Pathological Features With CLK3 Expression In ZZU HCC Cohort
Figure 2 High expression of CLK3 indicates poor prognosis of patients with HCC. (A) The expression levels of CLK3 in HCC or normal tissues were analyzed in 10 independent cohorts. (B) The expression levels of CLK3 in HCC patients with different TNM stages were analyzed in TCGA HCC cohort. (C) Kaplan–Meier analysis of OS of HCC patients with low- or high-expression of CLK3 in GSE14520 cohort. (D, E) Kaplan–Meier analysis of the correlation between CLK3 expression and OS (D) or disease-free survival (DFS) (E) in TCGA HCC cohorts. (F, G) Kaplan–Meier analysis of the correlation between CLK3 expression and OS (F), DFS (G) of HCC patient at different TMN stages in TCGA HCC cohorts. (H) The Pearson correlation analysis of CLK3 expression with Ki-67 and PCNA expression in TCGA HCC cancer cohort. (I) The Gene Set Enrichment Analysis of the correlation between CLK3 expression and gene signatures of survival in hepatocellular carcinomas. *p < 0.05, **p < 0.01 based on the nonparametric test.
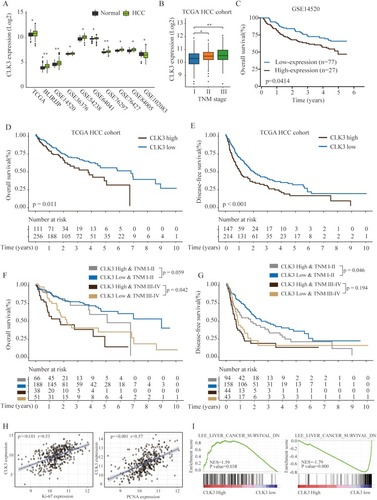
Figure 3 Knockdown of CLK3 inhibits HCC cell proliferation, migration and invasion. (A) HCC cells SMMC-7721 or SK-hep-1 were transfected with negative control (NC) or different shRNAs targeting CLK3. The knockdown efficiency was evaluated by Western blot 48 hrs later. (B) Effects of CLK3 knockdown on cell proliferation were determined by CCK-8 cell proliferation assays in SK-Hep-1 or SMMC-7721 cells. Data were represented as the means ± SD. (C) DNA synthesis in HCC cells SMMC-7721 or SK-hep-1 was measured using the EdU incorporation assay. (D) Effects of CLK3 knockdown on cell proliferation were determined by colony formation assay. (E) Transwell assays were performed to evaluate the effect of CLK3 knockdown on cell invasion capability. Cells were counted under a microscope in five randomly selected fields. (F) Wound-healing assays were performed to evaluate the effect of CLK3 knockdown on cell migration. *p < 0.05, **p < 0.01.
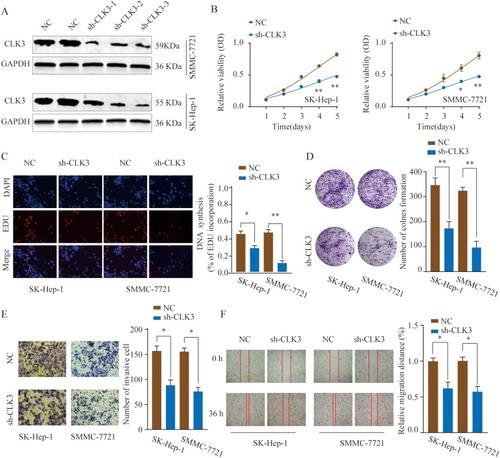
Figure 4 Knockdown of CLK3 suppresses HCC tumorigenesis in vivo. HCC cells SMMC-7721 transfected with Ctrl or sh-CLK3 were implanted subcutaneously into nude mice and tumor growth was monitored. (A) Growth curves of subcutaneous xenografts were determined based on tumor size measured every week. (B) Representative photos of nude mice and HCC tumor tissues from Ctrl or sh-CLK3 group at Week 5. (C) Relative photon flux of tumors in Ctrl or sh-CLK3 group was determined by quantifying the bioluminescent signal. (D) Tumor weight were measured and represented as means of tumor weights ± S.D. (E) Representative images of H&E staining and Ki-67, CLK3 IHC staining of tumor sections from Ctrl or sh-CLK3 group. (F) Quantification of relative Ki-67 and CLK3 staining intensity in tumor sections from the Ctrl or sh-CLK3 group. *p < 0.05, **p < 0.01.
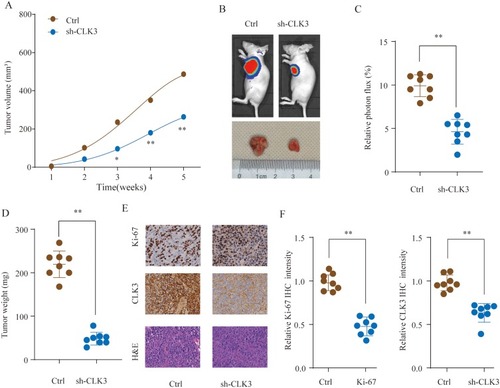
Figure 5 CLK3 activates the Wnt/β-catenin signaling pathway in HCC. (A) GSVA analysis showed that Wnt/β-catenin pathway in tumor compared with adjacent non-tumor were identified as the top three activated regulated pathways in TCGA HCC cancer cohort. (B, C) SMMC-7721 or SK-hep-1 cells were transfected with Ctrl or sh-CLK3 and the expression of Wnt3a and β-catenin was analyzed by Western blot. Relative quantification analysis was based on grayscale values. *p < 0.05, **p < 0.01.
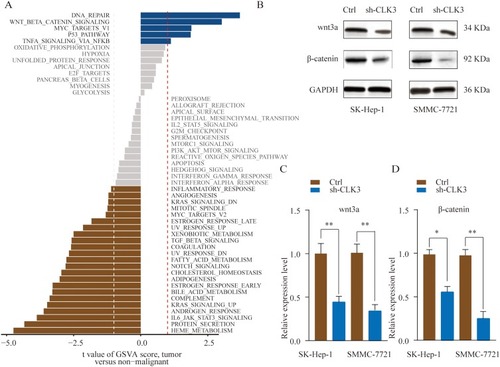
Figure 6 MiR-144 negatively regulates CLK3 expression by directly binding to 3ʹ-UTR of CLK3. (A) Putative binding sequences between has-miR-144 and WT 3ʹ-UTR of CLK3 mRNA or mutated 3ʹ-UTR of CLK3 mRNA. (B) WT 3ʹ-UTR or mutated 3ʹ-UTR of CLK3 was constructed into luciferase reporter vector and co-transfected with miR-144 mimics into HEK293 cells. Relative luciferase activity was determined 48 hrs after transfection. (C) The expression level of miR-144 in HCC and non-tumor normal tissues was analyzed in TCGA HCC cohort. (D, E) The expression levels of CLK3 mRNA (D) or protein (E) in SK-hep-1 or SMMC-7721 cells transfected with miR-144 mimic, miR-144 inhibitor or negative ctrl were analyzed by qRT-PCR or Western blot. (F) Pearson correlation analysis of the miR-144 expression and CLK3 expression in HCC tissues. **p < 0.01.
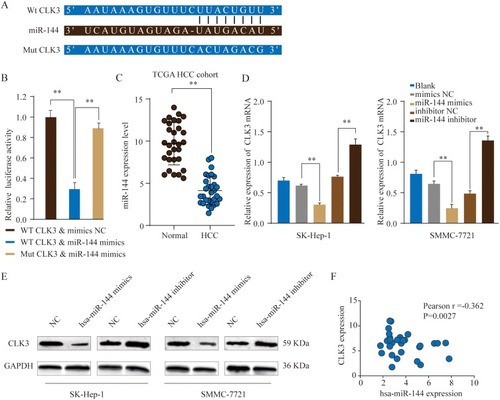
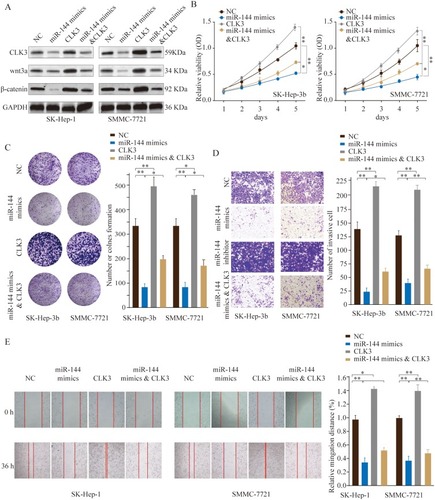
Figure 7 MiR-144 inhibits proliferation and metastasis of HCC cells in vitro by repressing CLK3. SMMC-7721 or SK-hep-1 cells were transfected with NC, miR-144 mimics, CLK3 overexpression only, or miR-144 mimics & CLK3 overexpression plasmid. (A) The expression levels of CLK3, Wnt3a and β-catenin were analyzed by Western blot 48 hrs later. (B) Cell proliferation was determined by CCK-8 cell proliferation assays. (C) Colonies of SMMC-7721 or SK-hep-1 cells in different groups were determined by colony formation assay. (D) Cell invasion capability of SMMC-7721 or SK-hep-1 cells in different groups was analyzed by transwell assay. (E) Cell migration capability of SMMC-7721 or SK-hep-1 cells in different groups was analyzed by wound-healing assay. *p < 0.05, **p < 0.01.