Figures & data
Table 1 Correlation Between ISG15 Expression and Clinicopathological Features of Colon Cancer Patients P-Value=0.0087*: the ISG15 Expression Was Associated with Poor Histological Classification
Figure 1 Upregulation of ISG15 expression in colon cancer samples. (A, B) ISG15 status in a colon cancer study obtained from http://www.cbioportal.org. (C) Expression of ISG15 in 286 TCGA cancer and 41 normal samples indicated that ISG15 was obviously upregulated in colon cancer. (D) Kaplan-Meier analysis indicated that high ISG15 expression predicted poorer prognosis in colon cancer. The error bars in all graphs represent SD, and each experiment was repeated three times (**p< 0.01 ). (E) The difference in protein expression levels of ISG15 in colon cancer tissues was compared with the corresponding adjacent tissues by Western blot in 12 pairs of human colon cancer specimens. (F, G) The differential expression of ISG15 in colon cancer samples (n = 66) and adjacent normal colon tissues (n =66) is shown by immunohistochemistry. ISG15 staining scores for tumor tissues and normal tissues are represented by a frequency distribution (0–4: low expression; 5–12: high expression).
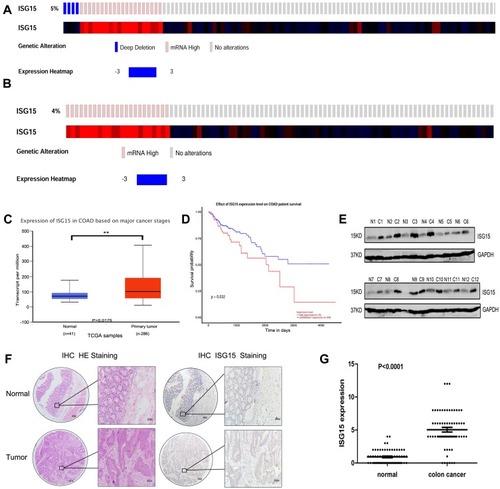
Figure 2 Knockdown ISG15 inhibits cancerous proliferation and migration. (A) Cell proliferation profiling in RKO, HCT116 and SW480 cells infected with si-ISG15#1 or si-ISG15#2 continuously for 3 days as analyzed by a CCK8 assay (*p< 0.05, **p< 0.01). (B) Protein levels of ISG15 in the RKO, HCT116 and SW480 cell lines infected with si-ISG15#1 or si-ISG15#2. GAPDH was used as an internal control. NC, Negative control; si-ISG15, siRNA of ISG15. (C, D) Colony formation in RKO, HCT116 and SW480 cells infected with si-NC or si-ISG15. The histogram shows the average colony numbers and represents the mean±SEM of three independent experiments (***p< 0.001). (E, F) Transwell invasion assay in si-NC or si-ISG15#1 transfected HCT116 and SW480 cells. The error bars in all graphs represent the SDs (***p< 0.001). (G, H) Wound-healing assay after transfecting with si-NC or si-ISG15#1 for 48 h in HCT116 and SW480 cells. Data are shown as the mean ± standard error of the mean (***p< 0.001).
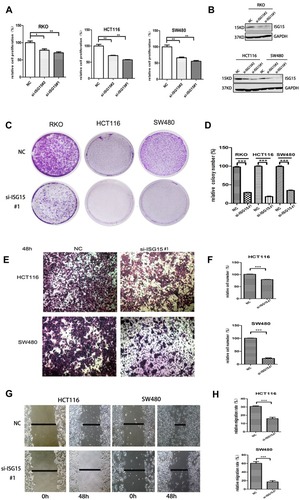
Table 2 Functional Enrichment Analysis of Up-Regulated Genes Were Significantly Enriched in Biological Process Terms (24h)
Figure 3 Trametinib treatment activates the expression of ISG15 as shown by the identification of DEGs. (A) Volcanoplot of the 193 identified DEGs at 24 hrs. Red indicates DEGs with a |log2FC|>1.5. DEG, differentially expressed gene; FC, fold change. (B) Heat map showing the 193 differentially expressed genes betweenthe trametinib (n=2) and control groups at 24 hrs. (n=2; >1.5-fold, p<0.05). The most highly upregulated (red) and downregulated (green) genes in the trametinib group are listed.
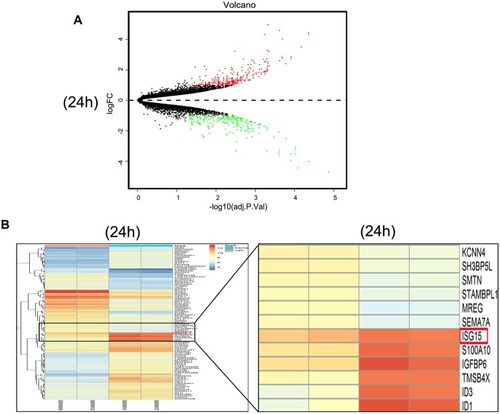
Figure 4 Functional enrichment analysis of upregulated DEGs in trametinib treatment for 24h. Using the STRING online database and Cytoscape, upregulated genes in the trametinib groups were filtered into the DEG PPI network complex. (IP6K2, ISG15, IFI6, IFI27, IFITM1, MIS18A and so on are hub genes in red or orange; other linked genes in blue).
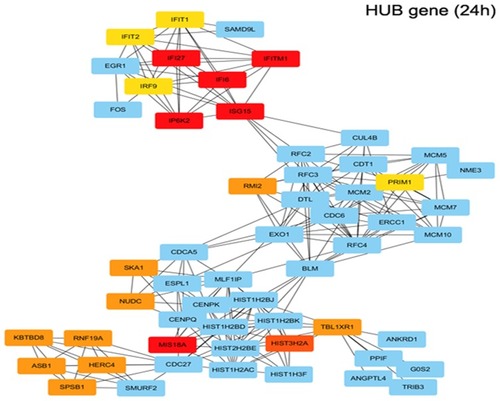
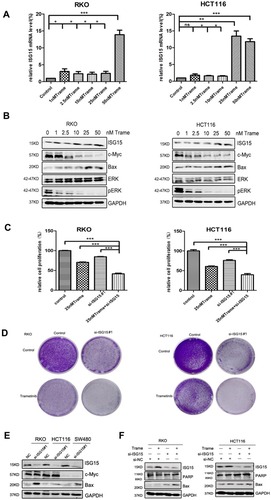
Figure 5 ISG15 inhibition enhances the anti-cancer effect of trametinib in colon cancer cells. (A) The mRNA expression of ISG15 following treatment with the indicated concentrations of trametinib (0–50 nM) in colon cancer cells for 2 d by qPCR assay (*p< 0.05, **p< 0.01, ***p< 0.001). (B) WB for ISG15, c-Myc, Bax, pERK and ERK following treatment with the indicated concentrations of trametinib (0–50 nM) in colon cancer cells for 2 d. (C) Histograms shows the percentage of cell proliferation in colon cancer cells after transfection with si-ISG15 and/or 25 nM trametinib by CCK8 assays at day 3 (***p< 0.001). (D) Colony formation assays show that knockdown of ISG15 combined with 25 nM trametinib inhibited colon cancer cell proliferation at day 7. (E) The levels of ISG15, c-Myc and Bax following ISG15 silencing in colon cancer cells for 3 d as determined via Western blot. NC, Negative control; si-ISG15, siRNA of ISG15. (F) The levels of ISG15, cleaved PARP and Bax following treatment with si-ISG15 (and/or 25 nM trametinib) in RKO and HCT116 cells for 3 d. NC, Negative control; si-ISG15, siRNA of ISG15.