Figures & data
Figure 1 Multiple strategies used in the study.
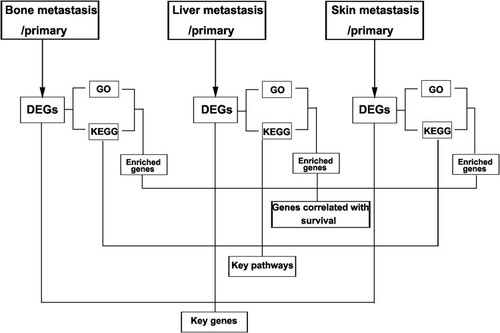
Figure 2 Clustering analysis of DEGs in three groups. (A) Bone metastatic group. (B) Liver metastatic group. (C) Skin metastatic group.
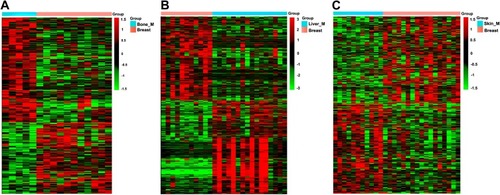
Figure 3 Top 20 GO enrichment analysis in three groups. (A and B) Upregulated and downregulated GO terms in the bone metastatic group. (C and D) Upregulated and downregulated GO terms in the liver metastatic group. (E and F) Upregulated and downregulated GO terms in the skin metastatic group.
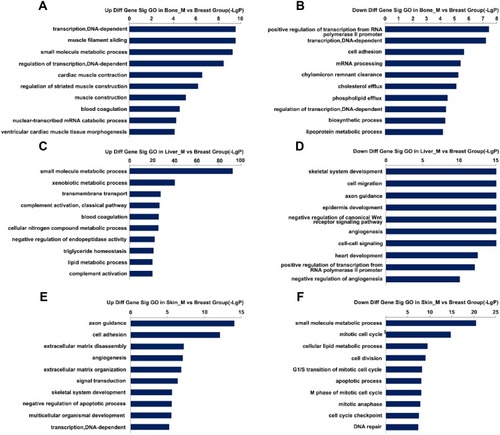
Figure 4 Top 20 KEGG enrichment analysis in three groups. (A and B) Upregulated and downregulated KEGG pathways in the bone metastatic group. (C and D) Upregulated and downregulated of KEGG pathways in the liver metastatic group. (E and F) Upregulated and downregulated of KEGG pathways in the skin metastatic group.
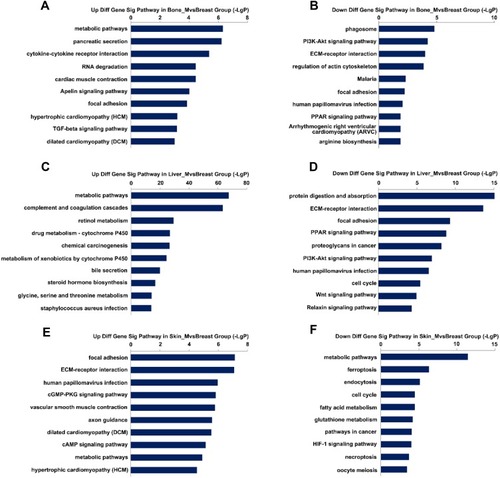
Figure 5 Kaplan-Meier analysis of relationship between expression of genes enriched in GO and KEGG pathways and survival in breast cancer in TCGA database. (A) The correlation of expression level of ALOX15 and survival. (B) The correlation of expression level of COL4A6 and survival. (C) The correlation of expression of LAMB3and survival. (D) The correlation of expression level of MTAP and survival. (E) The correlation of expression of level PLA2G4A and survival. (F) The correlation of expression level of TAT and survival.
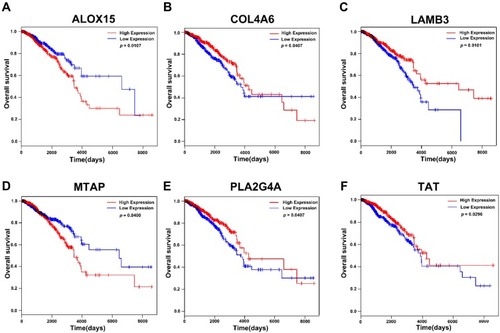
Table 1 The Detail Information of Key Genes Overlapped in the Three Groups
Table 2 The Detail Information of Key Pathways Overlapped in the Three Groups
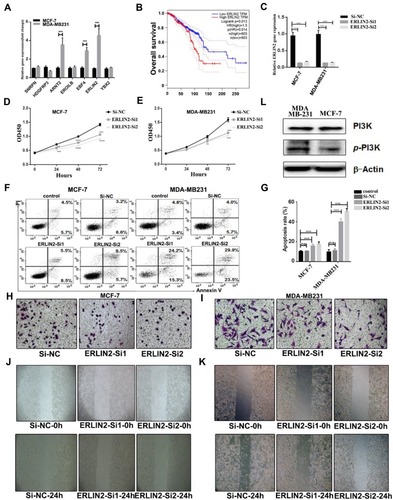
Figure 6 Validation of key genes and pathways in breast cancer. (A) Expression level of key genes in MCF-7and MDB-MA231 cancer cells. (B) The correlation of expression level of ERLIN2 and survival. (C) Validation of knockdown efficiency by RT-PCR. (D and E) The proliferation of MCF-7 and MDA-MB231 cells after transfected with Si-ERLIN2 or control. (F) The apoptosis of MCF-7 and MDA-MB231 cells after transfected with Si-ERLIN2 or control analyzed by flow cytometry. (G) Statistical analysis of the rate of apoptosis cells after transfected with Si-ERLIN2 or control. (H and I) Invasion assay analysis of MCF-7 cells after transfected with Si-ERLIN2 or control. (J and K) Wound healing assay analysis of MCF-7and MDA-MB231 cells after transfected with Si-ERLIN2 or control. (L) Total protein expression of PI3K and p-PI3K in MCF-7 and MDA-MB231 cells analyzed by Western blot. Results are representative of three independent experiments. (**P <0.01, ***P <0.001, ****P <0.0001).