Figures & data
Table 1 Association of SIX1 Expression with Clinicopathological Parameters in Patients with Thyroid Cancer
Figure 1 Expression Six1 in thyroid cancer tissues. (A) Negative/weak staining of Six1 in normal thyroid tissues. (B) Positive nuclear Six1 expression in a case of papillary thyroid cancer. (C) Positive nuclear Six1 staining in a case of follicular thyroid cancer. (D) Negative staining a case of follicular thyroid cancer. (E) TCGA data showed that Six1 mRNA was elevated in thyroid cancers compared with normal tissue (paired t test, p=0.0022). (F) TCGA data showed Six1 mRNA was higher in cancers with positive nodal metastasis (Mann–Whitney U-test, p=0.0192). Bar indicates 50uM.
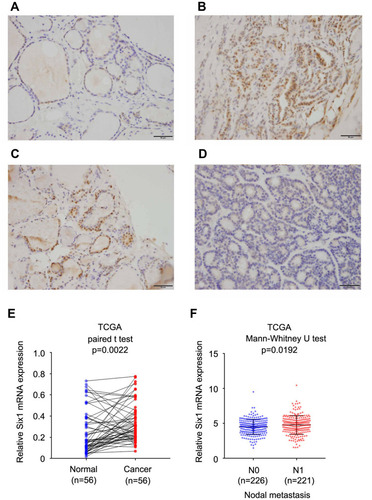
Figure 2 Six1 regulates cell proliferation in thyroid cancer cells. (A) Six1 protein expression in a 3 cell lines. Western blot showed efficiencies of Six1 plasmid transfection and siRNA knockdown in TPC-1 and B-CPAP cell lines. (B) Realtime PCR showed that Six1 transfection and siRNA knockdown efficiency in both TPC-1 and B-CPAP cell lines. (C) CCK-8 assay showed that that Six1 depletion downregulated the proliferation rate while Six1 overexpression upregulated proliferation rate in both TPC-1 and B-CPAP cells. (D) Colony formation assay demonstrated that Six1 overexpression upregulated colony number while Six1 depletion downregulated colony number in both cell lines. *p<0.05.
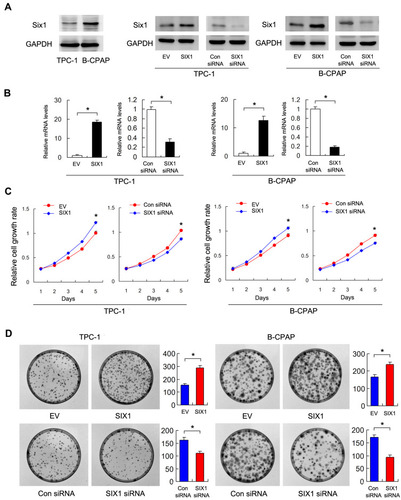
Figure 3 Six1 regulates invasion and glucose uptake. (A) Matrigel invasion assay demonstrated that Six1 overexpression increased invading cell numbers, while Eya2 knockdown decreased invading cell numbers in both TPC-1 and B-CPAP cell lines. (B) Glucose take assay using 2-NBDG staining and flow cytometry demonstrated that Six1 overexpression enhanced glucose uptake in while siRNA knockdown inhibited glucose uptake in both TPC-1 and B-CPAP cell lines. *p<0.05.
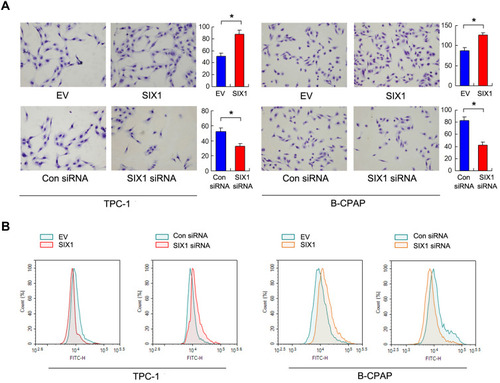
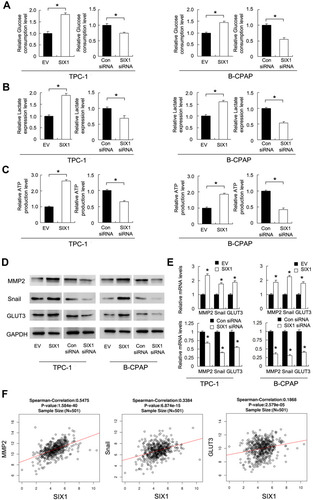
Figure 4 Six1 regulates glucose metabolism and GLUT3, Snail, MMP2 expression. (A) Relative glucose consumption rate in thyroid cancer cells transfected with Six1 plasmid and siRNA. (B) Relative lactate production rate in thyroid cancer cells transfected with Six1 plasmid and siRNA. (C) Relative ATP production level in cells with Six1 plasmid and siRNA. (D) Protein levels of MMP2, Snail and GLUT3 in thyroid cancer cells transfected with the Six1 plasmid and siRNA. (E) The mRNA levels of MMP2, Snail and GLUT3 in thyroid cancer cells transfected with Six1 plasmid and siRNA. (F) Pearson’s correlation analysis showing positive associations between Six1 and MMP2, Snail and GLUT3 mRNA in 501 cases of thyroid cancer tissues (TCGA dataset). *p<0.05.