Figures & data
Table 1 Primer Sequences Used in Reverse Transcriptase-Polymerase Chain Reaction of This Study
Table 2 Association Between lncRNA CCAT2, miR-424 Expression and Clinical Characteristics
Table 3 Multivariate Analysis of Risk Factors Associated with Overall Survival of Glioma Patients
Figure 1 Association of CCAT2 and miR-424 expressions with clinical characteristics and prognosis of glioma patients. (A) Expression of CCAT2 and miR-424 was compared between 128 pairs of glioma tissues and adjacent non-tumor tissues. *: P<0.05 when compared with adjacent non-tumor tissues. (B) Pearson correlation was conducted between CCAT2 expression and miR-424 expression among glioma patients. (C) Differentially expressed CCAT2 and miR-424 were associated with the prognosis of glioma patients.
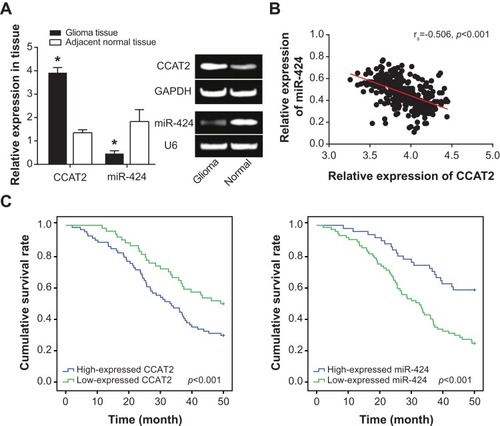
Figure 2 Role of CCAT2 and miR-424 in regulating chemosensitivity of glioma cells. (A) CCAT2 and miR-424 expressions were determined within glioma cells (i.e., U251, U87, A172 and SHG44) and NHA cells. *: P<0.05 when compared with NHA cells. (B) The inhibition rates were evaluated within glioma cells (i.e., U251, U87, A172 and SHG44) after the treatment of Teniposide, Temozolomide, Vincristine and Cisplatin. (C) CCAT2 expression was detected in SHG44 and U251 cells after the transfection of NC, pcDNA3.1, pcDNA3.1-CCAT2, si-RNA, si-CCAT2-1 and si-CCAT2-2. *: P<0.05 when compared with the NC group. (D) Expression of miR-424 in SHG44 and U251 cells was drawn when NC, miR mimic, miR-424 mimic, miR inhibitor and miR-424 inhibitor were transfected. *: P<0.05 when compared with the NC group. Survival of glioma cells was compared after treatment of chemo drugs and transfections of (E) pcDNA3.1-CCAT2/si-CCAT2-2 or (F) miR-424 mimic/miR-424 inhibitor. *: P<0.05 when compared with the NC group.
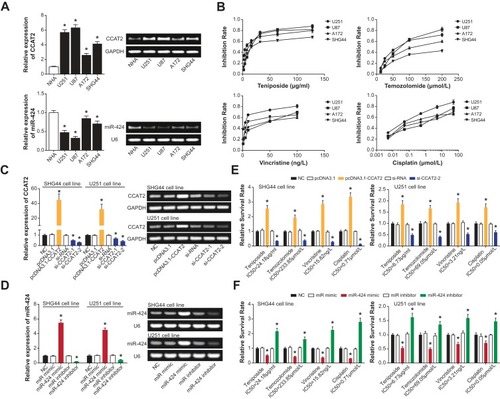
Figure 3 Regulatory roles of CCAT2 and miR-424 in viability and proliferation of glioma cells. (A) The viability of glioma cells was assessed under the effects of pcDNA3.1-CCAT2 and si-CCAT2-2 or miR-424 mimic and miR-424 inhibitor. *: P<0.05 when compared with the NC group. (B) The pcDNA3.1-CCAT2 and si-CCAT2-2 or miR-424 mimic and miR-424 inhibitor were appraised regarding their influence on the proliferation of glioma cells. *: P<0.05 when compared with the NC group. (C) Contributions of pcDNA3.1-CCAT2 and si-CCAT2-2 or miR-424 mimic and miR-424 inhibitor to the apoptotic rate of glioma cells were compared. *: P<0.05 when compared with the NC group.
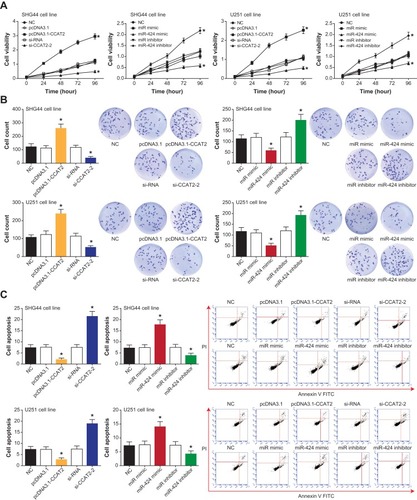
Figure 4 Modulation of EMT process by CCAT2 and miR-424 in glioma cells. (A) Invasion of glioma cells was measured under the effects of pcDNA3.1-CCAT2 and si-CCAT2-2 or miR-424 mimic and miR-424 inhibitor. *: P<0.05 when compared with the NC group. (B) Migratory trends of glioma cells were presented under the influence of pcDNA3.1-CCAT2 and si-CCAT2-2 or miR-424 mimic and miR-424 inhibitor. *: P<0.05 when compared with the NC group. (C) Proteins specific to EMT within glioma cells were quantified among pcDNA3.1-CCAT2 and si-CCAT2-2 or miR-424 mimic and miR-424 inhibitor groups. *: P<0.05 when compared with the NC group.
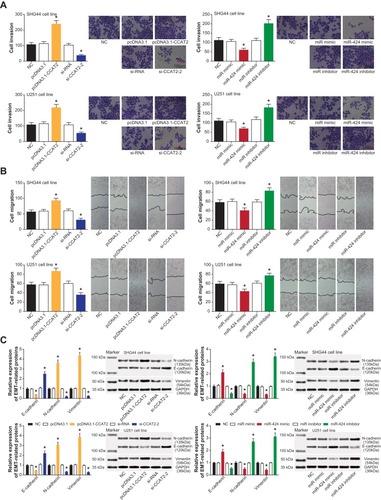
Figure 5 Modulatory effects of CCAT2 on miR-424 in glioma cells. (A) The luciferase activity of glioma cells was contrasted among pGL3-CCAT2-Wt+miR-424 mimic, pGL3-CCAT2-Wt+miR-NC and pGL3+miR-424 mimic groups. *: P<0.05 when compared with pGL3-CCAT2-Wt+miR-NC. (B) Expression of miR-424 was monitored within SHG44 and U251 cells that were transfected by pcDNA3.1-CCAT2 and si-CCAT2-2. *: P<0.05 when compared with the NC group. (C) Impacts of miR-424 mimic and miR-424 inhibitor on CCAT2 expression were also tracked. *: P<0.05 when compared with the NC group. (D) The targeting sites between miR-424 and CHK1 were illustrated, and glioma cells of pGL3-CHK1-Wt+miR-424 mimic, pGL3-CHK1-Wt+miR-NC and pGL3+miR-424 mimic groups were assessed regarding their luciferase activity. *: P<0.05 when compared with pGL3-CHK1-Wt+miR-NC. (E) CHK1 expression in SHG44 and U251 cells was determined after transfection of pcDNA3.1-CCAT2 and si-CCAT2-2 or miR-424 mimic and miR-424 inhibitor. *: P<0.05 when compared with the NC group.
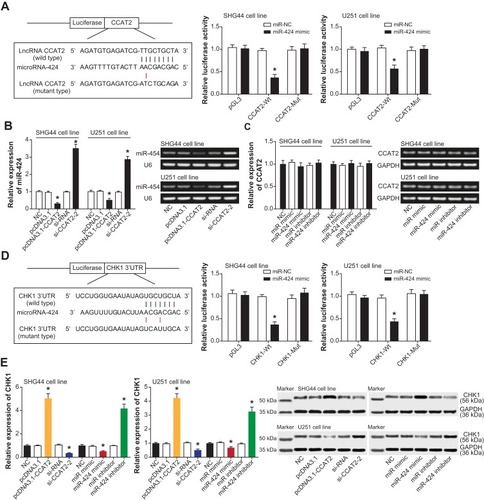
Figure 6 CHK1 mediated the role of miR-424 in affecting viability, proliferation and apoptosis of glioma cells. (A) The amount of CHK1 in SHG44 and U251 cells was verified after transfection of pcDNA3.1-CHK1. *: P<0.05 when compared with the NC group. (B) The viability of glioma cells was drawn among NC, miR-mimic, miR-424 mimic and miR-424 mimic+pcDNA3.1-CHK1 groups. *: P<0.05 when compared with the NC group. (C) The proliferative capacity of glioma cells was compared among NC, miR-mimic, miR-424 mimic and miR-424 mimic+pcDNA3.1-CHK1 groups. *: P<0.05 when compared with the NC group. (D) The apoptotic percentage of glioma cells was observed after respective treatments of NC, miR-mimic, miR-424 mimic and miR-424 mimic+pcDNA3.1-CHK1 groups. *: P<0.05 when compared with the NC group.
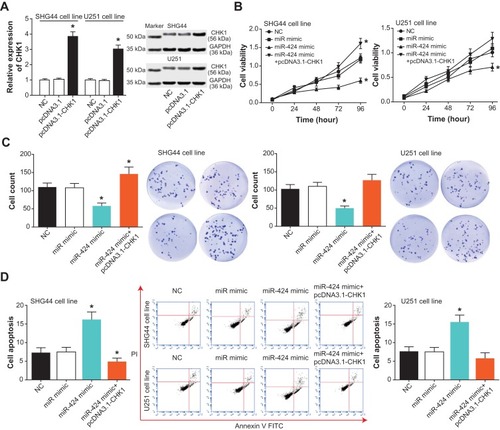
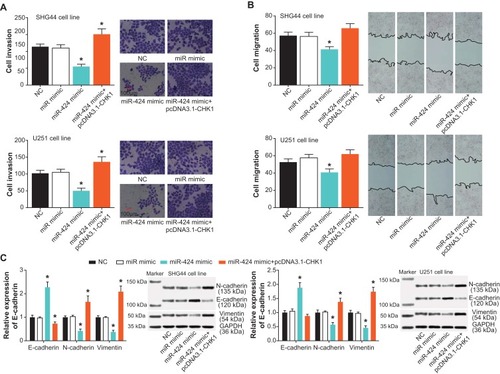
Figure 7 CHK1 intervened in the effects of miR-424 on metastasis of glioma cells. (A) The invasive abilities of glioma cells were tested under the influence of NC, miR-mimic, miR-424 mimic and miR-424 mimic+pcDNA3.1-CHK1 groups. *: P<0.05 when compared with the NC group. (B) The glioma cells were appraised concerning their migratory capacity among NC, miR-mimic, miR-424 mimic and miR-424 mimic+pcDNA3.1-CHK1 groups. *: P<0.05 when compared with the NC group. (C) Expressions of EMT-related proteins were measured within glioma cells handled with NC, miR-mimic, miR-424 mimic and miR-424 mimic+pcDNA3.1-CHK1 groups. *: P<0.05 when compared with the NC group.