Figures & data
Table 1 Overall Patient Characteristics
Table 2 Correlation Between The Expression Level Of THUMPD3-AS1 And The Clinicopathological Features Of NSCLC Patients
Figure 1 THUMPD3-AS1 was abnormal upregulated in NSCLC and involved in the regulation of cell proliferation and self-renewal. (A) Scatter plots of expression levels of THUMPD3-AS1 in NC and C tissues of NSCLC. NC, adjacent carcinoma tissues; C, primary carcinoma tissues. (B) THUMPD3-AS1 expressions were increased after transfection of THUMPD3-AS1 plasmids and decreased after transfection of THUMPD3-AS1 shRNAs in A549 and H1299 cells. (C) Cell growth assay was used to observe the regulation effect of THUMPD3-AS1 on the cell growth in A549 and H1299 cells. (D) Colony formation assay was used to observe the regulation effect of THUMPD3-AS1 on the colony-formation capability in A549 and H1299 cells. (E) Sphere formation assay was used to observe the regulation effect of THUMPD3-AS1 on the size and number of spheres in A549 and H1299 cells. (*P < 0.05, error bar refers to SD).
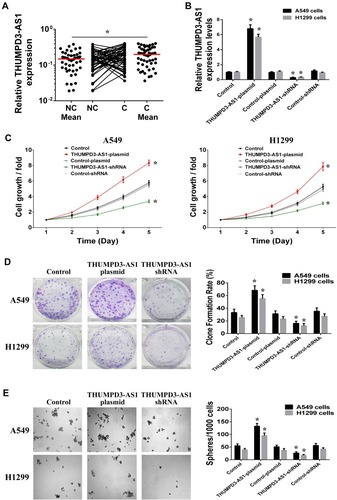
Figure 2 THUMPD3-AS1 function as a ceRNA by interacting with miR-543. (A) The subcellular location of THUMPD3-AS1 was tested in A549 and H1299 cells which were fractionated into cytoplasmic and nuclear fractions. U6 and GAPDH served as nucleus and cytoplasm control, respectively. (B) THUMPD3-AS1 contains the binding site for miR-543, including wild type and mutant type. (C) THUMPD3-AS1 regulated the expression of miR-543 in A549 and H1299 cells. (D) Luciferase reporter assay was used to observe the binding effect of miR-543 on the THUMPD3-AS1. (E) RNA pull-down assay was used to observe the direct binding between THUMPD3-AS1 and miR-543. (*P < 0.05, error bar refers to SD).
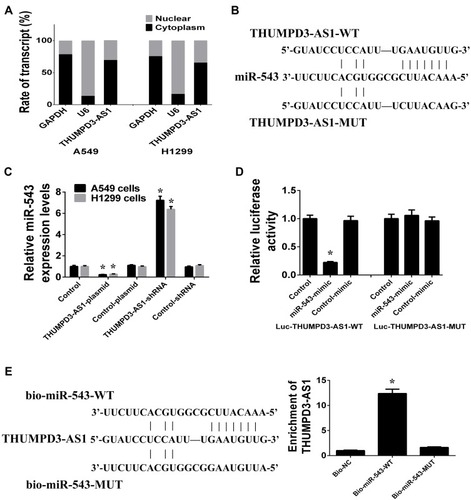
Figure 3 ONECUT2 was the direct target gene of miR-543. (A) The 3ʹ untranslated region (3ʹUTR) of ONECUT2 contains the binding site for miR-543, including wild type and mutant type. (B) miR-543 regulated the protein and mRNA expression of ONECUT2 in A549 and H1299 cells. (C) Luciferase reporter assay was used to observe the binding and targeting effects of miR-543 on the 3ʹUTR of ONECUT2. (*P < 0.05, error bar refers to SD).
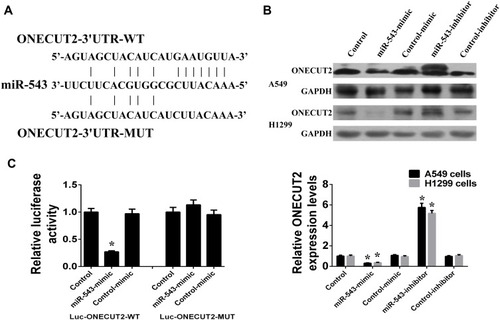
Figure 4 THUMPD3-AS1 act as endogenous sponge of miR-543 to regulate ONECUT2 indirectly. (A) THUMPD3-AS1 regulates the protein and mRNA expression of ONECUT2 through miR-543 in A549 and H1299 cells. (B) Luciferase reporter assay was used to confirm the regulating effects of THUMPD3-AS1 on the 3ʹUTR of ONECUT2 through miR-543. (*P < 0.05, error bar refers to SD).
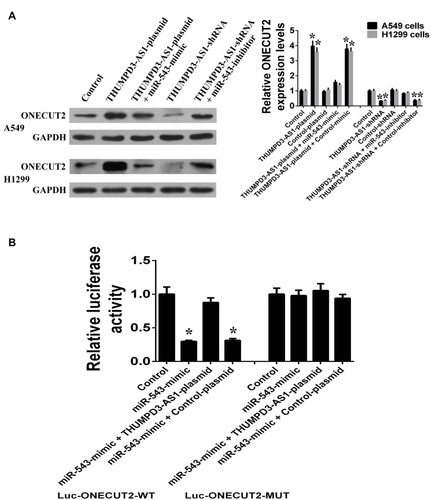
Figure 5 THUMPD3-AS1 regulated cell proliferation and self-renewal by miR-543 and ONECUT2. (A) Individual or combined regulation of ONECUT2 and miR-543 influenced the regulation effect of THUMPD3-AS1 on the cell growth in A549 and H1299 cells. (B) Individual or combined regulation of ONECUT2 and miR-543 influenced the regulation effect of THUMPD3-AS1 on the colony-formation capability in A549 and H1299 cells. (C) Individual or combined regulation of ONECUT2 and miR-543 influenced the regulation effect of THUMPD3-AS1 on the size and number of spheres in A549 and H1299 cells. (*P < 0.05, error bar refers to SD).
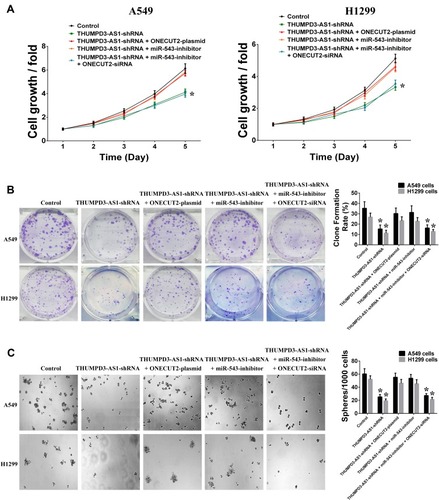
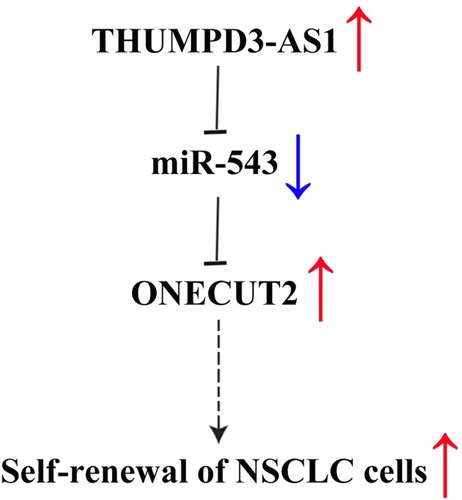
Figure 6 A summary diagram of THUMPD3-AS1, miR-543 and ONECUT2 function on self-renewal in NSCLC.