Figures & data
Figure 1 Elevated expression of the OPN gene in human NSCLC tissues. (A) Relative expression of OPN mRNA in 125 human NSCLC tissues and 37 normal tissues based on TCGA data. (B) Heatmap of OPN (also known as SPP1) gene expression in clinical NSCLC samples and normal tissues based on Oncomine data. ****P<0.0001. (1. Lung Adenocarcinoma vs Normal Bhattacharjee Lung, Proc Natl Acad Sci USA, 2001;Citation21 2. Lung Adenocarcinoma vs Normal Hou Lung, PLoS One, 2010;Citation22 3. Lung Adenocarcinoma vs Normal Landi Lung, PLoS One, 2008;Citation23 4. Lung Adenocarcinoma vs Normal Selamat Lung, Genome Res, 2012;Citation24 5. Lung Adenocarcinoma vs Normal Su Lung, BMC Genomics, 2007.Citation25)
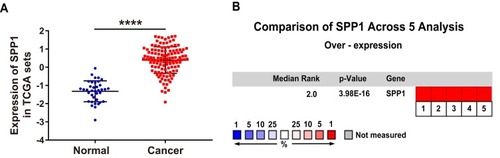
Figure 2 Overexpression of OPN induces proliferation, migration, and invasion in NSCLC cells. (A–C) Transfection efficiency of OPN in A549 cells was detected by qPCR and Western blotting. (D) CCK-8 assay was used to detect the proliferation of A549 cells with different transfection conditions. (E, F) The wound healing distance was measured 18 h after the scratch-wound was made for the invasion distance. Scale bars, 500 μm. (G, H) Migration and invasion were detected through transwell assays. Scale bars, 200 μm. *P<0.05, **P<0.01, ***P<0.001.
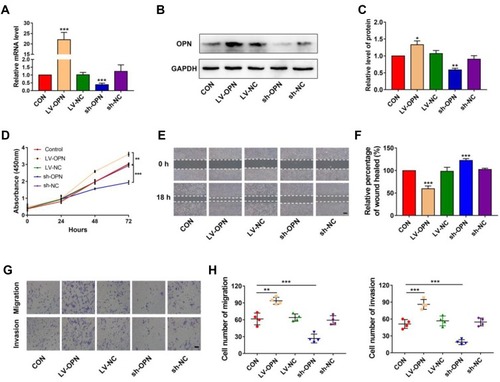
Figure 3 OPN promotes a malignant phenotype via the MAPK pathway. (A, B) Western blot analysis of p-MEK and p-ERK proteins in different transfected cells. (C, D) Western blot analysis of p-MEK and p-ERK proteins in different groups. (E, F) The wound healing distance was measured in different groups. Scale bars, 500 μm. (G, H) Transwell assay revealed the role of MAPK in the migration and invasion of OPN-transduced cells. Scale bars, 200 μm. *P<0.05, **P<0.01, ***P<0.001.
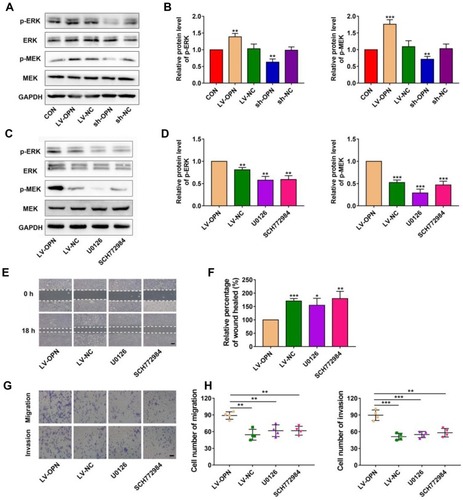
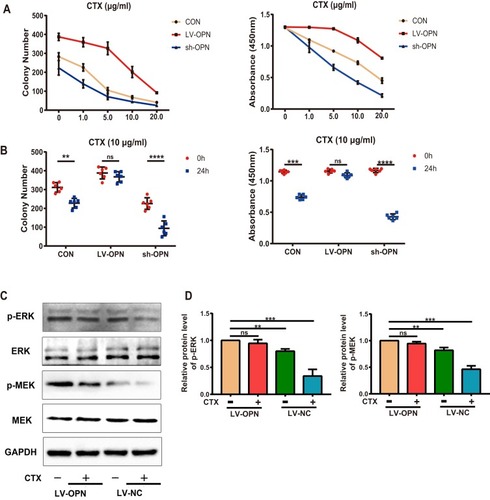
Figure 4 OPN confers resistance to CTX via the MAPK pathway. (A, B) Colony numbers of different transfected cells were determined at different CTX doses and treatment times. (C, D) Western blot analysis of p-MEK and p-ERK proteins in the overexpression group treated with CTX (10 μg/mL) for 24 h. **P<0.01, ***P<0.001, ****P<0.0001.