Figures & data
Table 1 The Immunoreactive Score (IRS) Used to Estimate the Immunoreaction of GD2
Figure 1 GD2 is highly expressed in retinoblastoma and is related to an advanced stage and fast proliferation. (A) Representative images of heterogeneous GD2 staining in retinoblastoma tissues (n=54). The staining intensity was classified as negative, weak, moderate or strong by two experienced pathologists. Normal retina tissues (n=13) were stained as a negative control. (B) The percentage of GD2-positive cells was estimated by FC in the normal control cell line ARPE-19, two retinoblastoma cell lines Y79 and WERI-Rb-1, and two primary retinoblastoma cultures RBJY and SNPH-Rb-C24. Numerical values denote the mean ± SD. (C) The correlation of the GD2 IRS with TNM stage in GD2-positive retinoblastoma species. The sample from TxN1M0/TxN0M1 was excluded due to the small population (n=1). Numerical values denote the mean ± SD. *p < 0.05 by one-way ANOVA. (D) The average GD2 IRS between the grade 3 and grade 4 Ki67 groups. Numerical values denote the mean ± SD. **p < 0.01 by Student’s t-test.
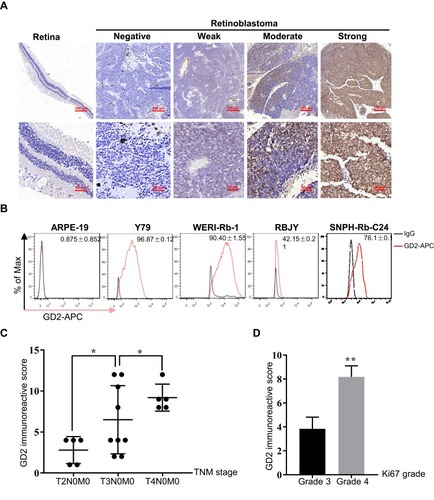
Table 2 Correlation of GD2 Expression and the Clinicopathologic Factors of Chinese Retinoblastoma Patients
Figure 2 The immune response of the ocular microenvironment is deregulated. (A) GSEA enrichment plots demonstrate significant enrichment of the complement, inflammatory response and IL6/JAK/STAT3 gene sets in retinoblastoma versus retina samples. The normalized enrichment score (NES) and P value are listed on the enrichment plot. (B) GSEA enrichment plots demonstrate the deregulated NK cell-mediated immunity gene sets in retinoblastoma versus retina samples. The NES and P value are listed on the enrichment plot. (C) Heat map of genes enriched in NK cell-mediated immunity.
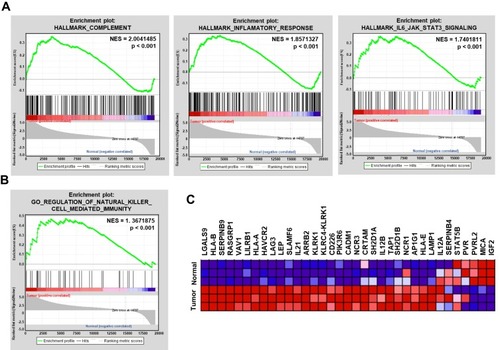
Figure 3 The blood-retinal barrier is disrupted by retinoblastoma. (A–D) Representative immunohistochemical images of CD3 and CD20 in retinoblastoma and normal retina tissues. (E–I) Representative images of vitreous bodies from retinoblastoma patients without vitreous hemorrhage. The images of Giemsa staining (E), CD3 staining (F), CD20 staining (G), granzyme B staining (H), and the normal vitreous control (I) were taken at different magnifications as indicated.
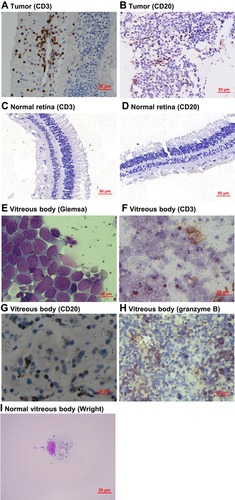
Figure 4 Dinutuximab enhances the cytolysis of retinoblastoma cells by NK-92MIhCD16-GFP cells determined by the LDH release assay. (A) Light and fluorescent microscopy images of NK-92MIhCD16-GFP cells. (B) The percentage of GFP-positive NK-92MIhCD16-GFP cells and membrane CD16 expression were determined by FC. In the absence or presence of dinutuximab, NK-92MIhCD16-GFP cells were cocultured with a constant number of Y79 (C), WERI-Rb-1 (D), RBJY (E) and SNPH-Rb-C24 (F) cells at E:T ratio of 1:1, 5:1, and 10:1. The supernatants were collected for the LDH release assay by a colorimetric reaction. Numerical values denote the mean ± SD of three independent experiments. *p < 0.05, **p < 0.01, and ***p < 0.001 by Student’s t-test.
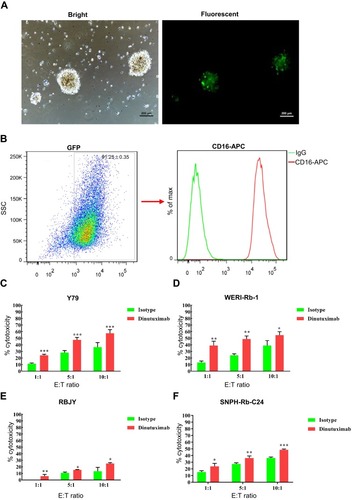
Figure 5 Dinutuximab increases the apoptosis of retinoblastoma cells by NK-92MIhCD16-GFP cells, as detected by FC. Retinoblastoma cells were labeled with CM-Dil. NK-92MIhCD16-GFP cells were cocultured with a constant number of target cells at E:T ratios of 1:1, 5:1, and 10:1, without or with dinutuximab. Apoptotic and dead cells were assessed by FC using annexin V-APC and 7-AAD. (A) Representative density plots of the discrimination of effector and target cells by GFP and the cytotoxicity of NK-92MIhCD16-GFP cells against Y79 cells at various E:T ratios in the absence or presence of dinutuximab. (B–E) Cytotoxicity of NK-92MIhCD16-GFP cells toward Y79, WERI-Rb-1, RBJY and SNPH-Rb-C24 cells labeled with CM-Dil. Numerical values denote the mean ± SD of three separate experiments. ns: not significant; *p < 0.05, **p < 0.01, and ***p < 0.001 by Student’s t-test.
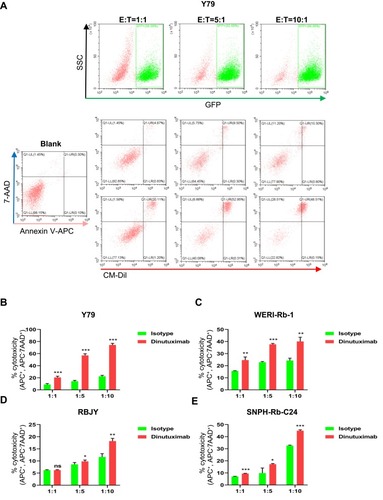
Figure 6 Dinutuximab augments the cytotoxicity of NK-92MIhCD16-GFP cells against retinoblastoma cells by increasing perforin-granzyme B release and CD107a expression. (A, B) NK-92MIhCD16-GFP cells were cocultured with a constant number of retinoblastoma cells for 6 hours at an E:T ratio of 10:1 in the absence or presence of dinutuximab. The supernatants were collected to detect perforin (A) and granzyme B (B) by ELISAs. (C) NK-92MIhCD16-GFP cells were cocultured with retinoblastoma cells at an E:T ratio of 1:1 for 3 hours with or without dinutuximab, followed by the addition of monensin for an additional incubation lasting 3 hours. CD107a was measured in GFP-gated NK-92MIhCD16-GFP cells by FC. Representative density plots and proportions of CD107a expression in NK-92MIhCD16-GFP cells in the absence or presence of dinutuximab are shown. (D) The baseline expression of CD107a in NK-92MIhCD16-GFP cells, results of three independent experiments are denoted as the mean ± SD on the density plot. (E) Quantitation of (C). Numerical values denote the mean ± SD of three independent experiments. *p < 0.05, **p < 0.01, and ***p < 0.001 by Student’s t-test.
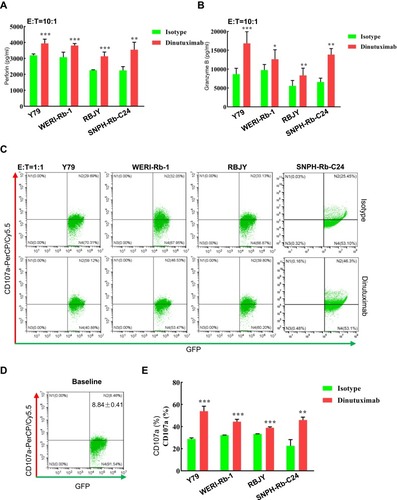
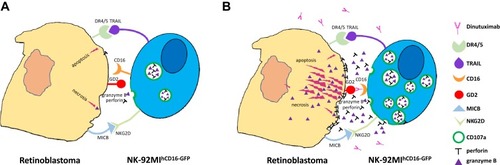
Figure 7 A proposed killing model of NK-92MIhCD16-GFP cells and dinutuximab to retinoblastoma cells. (A) NK-92MIhCD16-GFP cells are able to induce weak apoptosis and necrosis of retinoblastoma cells through intrinsic active receptors on NK-92MIhCD16-GFP cells and minimum perforin and granzyme B released by NK-92MIhCD16-GFP cells. (B) Dinutuximab acts as the bridge of GD2 on the retinoblastoma cells and CD16 on the NK-92MIhCD16-GFP cells, which triggers intense ADCC and leads to massive death of retinoblastoma cells, meanwhile, CD107a protects NK-92MIhCD16-GFP cells from cytotoxic granules.