Figures & data
Figure 1 Mir-100 is reduced in NPC clinical samples and cell lines. (A–C) Relative miR-100 expression in NPC tissues and normal nasopharynx tissues in three publicly available microarray data. (D) Relative expression of miR-100 in the immortalized nasopharyngeal epithelial cell line NP69 and six NPC cell lines. (E, F) Relative expression of miR-100 in SUNE1 and HONE1 cells transfected with miR-100 mimics, miR-100 inhibitor or miR-Ctrl. U6 was used as the endogenous control. Data are presented as the mean ± SD, and the p values were calculated using the Student’s t-test; * p<0.05.
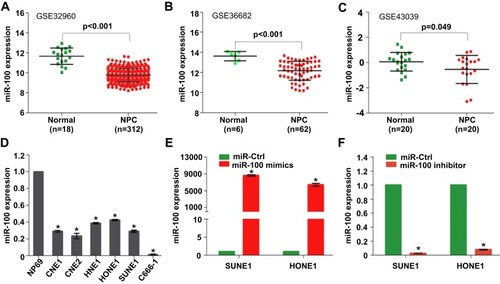
Figure 2 Overexpression of miR-100 inhibits NPC cell growth and proliferation. (A, B) Cell growth viabilities of SUNE1 and HONE1 cells transfected with miR-100 mimics or miR-Ctrl determined by the MTT assay. (C–D) Representative images and quantification of colonies of SUNE1 and HONE1 cells transfected with miR-100 mimics or miR-Ctrl determined by the colony formation assay. Data are presented as the mean ± SD, and the p values were calculated using the Student’s t-test; * p<0.05.
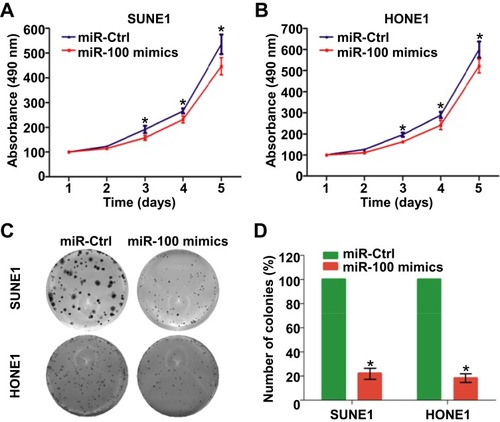
Figure 3 Silencing of miR-100 promotes NPC cell growth and proliferation. (A, B) Cell growth viabilities of SUNE1 and HONE1 cells transfected with miR-100 inhibitor or miR-Ctrl determined by the MTT assay. (C, D) Representative images and quantification of colonies of SUNE1 and HONE1 cells transfected with miR-100 inhibitor or miR-Ctrl determined by the colony formation assay. Data are presented as the mean ± SD, and the p values were calculated using the Student’s t-test; * p<0.05.
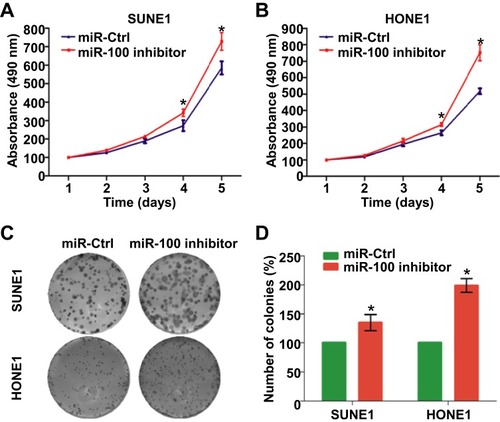
Figure 4 HOXA1 is a direct target of miR-100 and its expression is decreased in NPC (A) Wild-type (WT) and mutant (MT) 3′-UTR of HOXA1 with putative bind site of miR-100. (B) Relative luciferase activities of SUNE1 and HONE1 cells determined by the luciferase reporter assay. (C, D) The mRNA and protein expression of HOXA1 in SUNE1 and HONE1 cells transfected with miR-100 mimics or miR-Ctrl. (E, F) The mRNA and protein expression of HOXA1 in NPC cell lines determined by quantitative RT-PCR and Western blot. The data are presented as the mean ± SD; p values were calculated using Student’s t-test; * p<0.05.
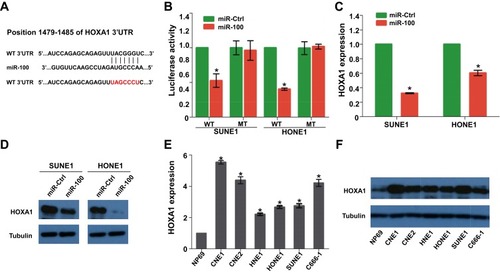
Figure 5 Restoration of HOXA1 reverses the inhibitive effect of miR-100 in NPC (A, B) Cell growth viabilities of SUNE1 and HONE1 cells transfected with miR-100 mimics and HOXA1 plasmids or empty vector determined by the MTT assay. (C, D) Representative images and quantification of colonies of SUNE1 and HONE1 cells transfected with miR-100 mimics and HOXA1 plasmids or empty vector determined by colony formation assay. Data are presented as the mean ± SD, and the p values were calculated using the Student’s t-test; * p<0.05.
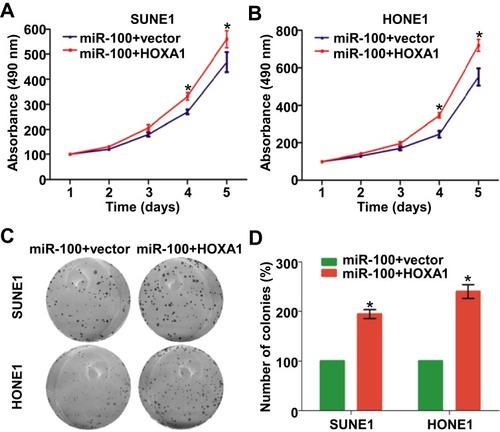
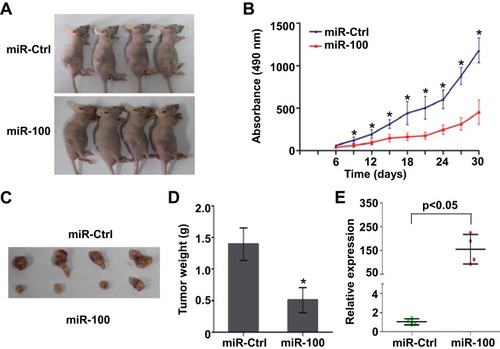
Figure 6 Overexpression of miR-100 inhibits NPC xenograft tumor growth (A) Xenograft tumor growth models in nude mice were constructed by injecting with SUNE1 cells stably expressing miR-100 or miR-Ctrl, and the xenograft tumors were formed. (B) The growth curves of the tumor volumes. (C) Representative images of the excised tumors. (D) The weights of the excised tumors. (E) Relative expression of miR-100 in xenograft tumors of the miR-100 overexpression group and miR-Ctrl group. Data are presented as the mean ± SD, and the p values were calculated using the Student’s t-test; * p<0.05.