Figures & data
Table 1 Correlation Between miR-181a Level and Clinicopathological Characteristics in NPC (N=101, χ2 Test)
Figure 1 Mir-181a is upregulated in radioresistant NPC and negatively correlates to the prognosis of NPC.
Notes: qPCR assays indicated that miR-181a was upregulated in CNE2-IR cells (1.012±0.125 vs 3.12±0.35) (A), NPC tissue samples (0.951±0.517 vs 2.075±0.935) (B) and radioresistant NPC tissue samples (1.696±0.881 vs 2.529±0.792) (C) compared with CNE2, NNM tissue samples, and radiosensitive NPC tissue samples, respectively. (D) The patient of high miR-181a exhibited poor overall survival demonstrating by Kaplan-Meier survival analysis. ***Stands for P <0.001.
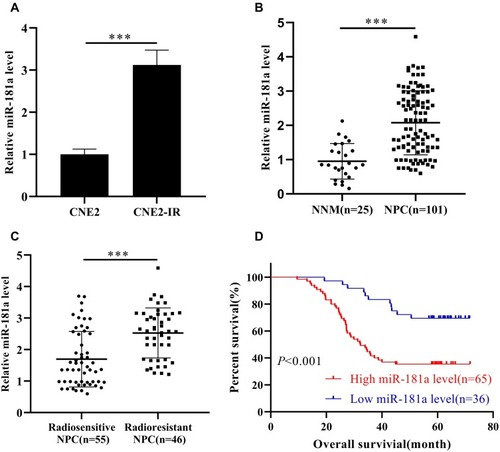
Figure 2 Mir-181a promotes NPC radioresistance in vitro.
Notes: Ectopic expression of miR-181a improved the cell viability (A, upper panel), survival clones (B, left panel, 85±12 vs 185±23), and non-apoptotic cell rates (C, left panel, 15.02±2.51 vs 9.1±1.49) of CNE2 under 4Gy irradiation. Accordingly, overexpression of miR-181a inhibitor impaired the cell viability (A, lower panel), survival clones (B, right panel, 201±28 vs 80±14), and non-apoptotic cell rates (C, right panel, 8.31±1.12 vs 14.53±2.35) of CNE2-IR under 4Gy irradiation. *Stands for P <0.05, **Stands for P <0.01.
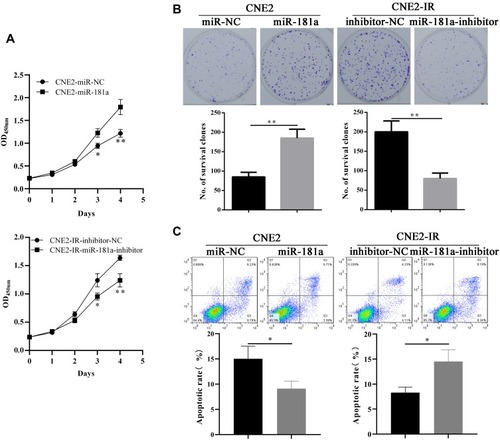
Figure 3 Mir-181a could directly target RKIP in NPC.
Notes: qPCR and Western blot assays showed that miR-181a overexpression could inhibit RKIP mRNA (A, left panel, 1.02±0.11 vs 0.36±0.08) and RKIP protein (B, left panel) level, while miR-181a inhibitor overexpression could upregulate RKIP mRNA (A, right panel, 1.03±0.12 vs 2.5±0.29) and RKIP protein (B, right panel) level. (C) The relative luciferase activity of CNE2 transfected with wild type RKIP reporter plasmid was significantly inhibited (1.03±0.14 vs 0.35±0.08), whereas, the no inhibitory effect was not observed in CNE2 transfected with mutant type RKIP reporter plasmid(1.02±0.13 vs 0.93±0.12). **Stands for P <0.01, ns stands for “no significant difference.”
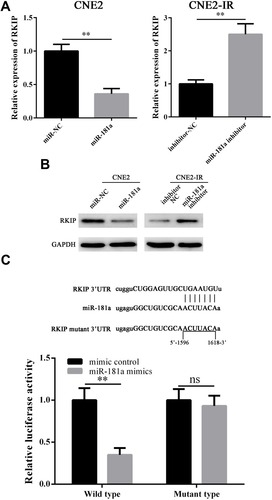
Figure 4 Mir-181a promotes NPC radioresistance via targeting RKIP in vitro.
Notes: (A) Western blot showed that miR-181a overexpression notably downregulated RKIP in CNE2 cells which could be rescued by ectopic expression of RKIP (left panel). Accordingly, miR-181a inhibitor overexpression significantly upregulated RKIP in CNE2-IR cells, which could be inhibited by specific small interfering RNA targeting RKIP (right panel). Upon 4 Gy irradiation, CCK-8, clone survival, and apoptosis assays indicated that miR-181a overexpression significantly reinforced cell viability (B, left panel), promoted cell survival (C, upper panel, 88±11 vs 183±21 vs 92±13), and decreased apoptosis (D, left panel, 15.84±2.82 vs 8.6±1.31 vs 13.12±2.13), and these effects could be antagonized by ectopic RKIP, in CNE2 cells; while, miR-181a inhibitor overexpression remarkably impaired cell viability (B, right panel), inhibited cell survival (C, lower panel, 198±25 vs 83±12 vs 183±12), and promoted apoptosis (D, right panel, 8.43±0.99 vs 13.62±1.87 vs 9.22±1.98), and these effects could be rescued siRNA mediated RKIP knockdown, in CNE2-IR cells. *Stands for P <0.05, **Stands for P <0.01.
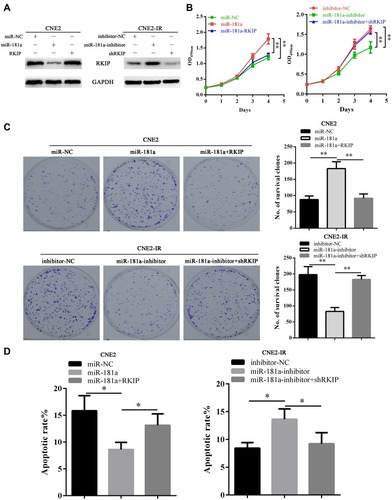
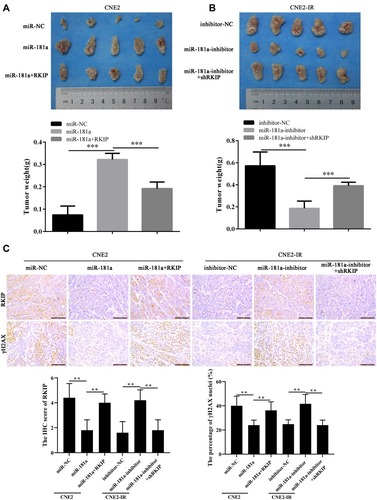
Figure 5 Mir-181a promotes NPC radioresistance by inhibiting RKIP in vivo.
Notes: The mice bearing xenografts were treated by 6Gy irradiation, and the tumors were resected and photographed. In line with the results in vitro, demonstrated by weight of xenografts, miR-181a overexpression enhanced the irradiation tolerance of CNE2 cells, and ectopic expression of RKIP re-sensitized CNE2 cells to irradiation (0.074±0.04 vs 0.322±0.03 vs 0.192±0.03) (A); similarly, miR-181a inhibitor overexpression sensitized CNE2-IR cells to irradiation, and RKIP knockdown re-reinforced the tolerance of CNE2-IR cells to irradiation (0.572±0.12 vs 0.186±0.06 vs 0.392±0.03) (B). (C) As the IHC staining of RKIP showed, the expression of RKIP pattern in xenografts was consistent with expression pattern in its corresponding NPC cells(4.4±1.02 vs 1.8±0.75 vs 4±0.63; 1.6±0.8 vs 4.2±0.75 vs 1.8±0.0.75). As the staining of γH2AX indicated, miR-181a overexpression alleviated the degree of DNA damage, which could be antagonized by ectopic expression of RKIP, in CNE2 cells (40±7.07 vs 24±3.74 vs 36.2±6.33); accordingly, miR-181a inhibitor upregulation enhanced the degree of DNA damage which could be counteracted by RKIP knockdown, in CNE2-IR cells (24.8±3.19 vs 41.6±6.95 vs 24±3.74). **Stands for P <0.01, ***Stands for P <0.001.