Figures & data
Figure 1 Downregulation of miR-575 significantly upregulated the proliferation of GBC cells. GBC-SD or G415 cells were transfected with miR-575 agonist, miR-575 antagonist, negative control (NC) or nothing (Blank) for 24 h. (A) The expression of miR-575 in GBC-SD or G415 cells was detected by using qRT-PCR. (B) After 0, 24, 48, or 72 h of incubation, the OD value of GBC-SD cells was determined using CCK-8 assay. (C) After 0, 24, 48, or 72 h of incubation, the OD value of G415 cells was determined using CCK-8 assay. (D) After 48 h of incubation, the expression of Ki-67 in GBC-SD cells was detected by immunofluorescence staining. The expression of Ki-67 in GBC-SD cells was quantified by integrated optical density (IOD). (E) After 48 h of incubation, the expression of Ki-67 in G415 cells was detected by immunofluorescence staining. The expression of Ki-67 in G415 cells was quantified by integrated optical density (IOD). Each group were performed at least three independent experiments. *P<0.01 vs control group; **P<0.01 vs control group.
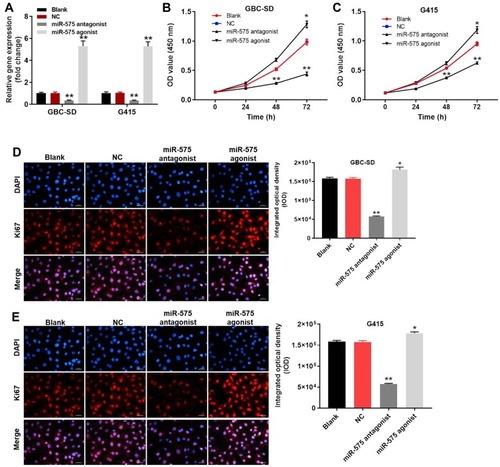
Figure 2 Downregulation of miR-575 significantly induced the apoptosis and inhibited the invasion in GBC-SD cells. GBC-SD cells were transfected with miR-575 antagonist, miR-575 agonist, or NC for 24 h. Then, cells were incubated for another 48 h. (A, B) The rate of apoptotic cells was detected by FACS after double staining with Annexin V and PI. X-axis: the level of Annexin-V FITC fluorescence; Y-axis: the PI fluorescence. (C, D) The invasion of GBC-SD cells was detected with transwell assay. Each group were performed at least three independent experiments. *P<0.01 vs control group; **P<0.01 vs control group.
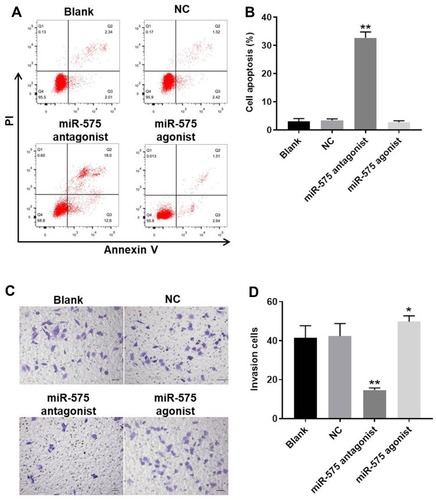
Figure 3 MiR-575 directly targeted p27 Kip1. (A, B) Gene structure of p27 Kip1 at the position of 498–505 indicates the predicted target site of miR-575 in its 3ʹUTR, with a sequence of GGAAUUC. (C) The luciferase activity was measured after co-transfecting with WT/MT p27 Kip1 3′-UTR plasmid and miR-575 agonist in GBC-SD cells using the dual-luciferase reporter assay. The results were normalized to Renilla luciferase. (D) GBC-SD cells were transfected with miR-575 agonist, NC, or nothing (Blank) for 24 h and the cells were incubated for another 48 h. Protein expression of p27 Kip1 in GBC-SD cells was detected with Western blotting. (E) The relative expression of p27 Kip1 was quantified via normalization to β-actin. Each group were performed at least three independent experiments. **P<0.01 vs control group.
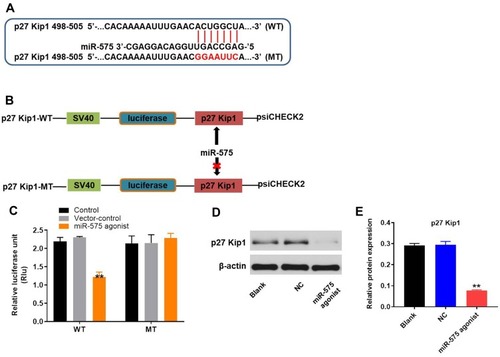
Figure 4 Downregulation of miR-575 induced G1 arrest in GBC-SD cells. GBC-SD cells were transfected with miR-575 antagonist, miR-575 agonist, nothing, or miR-NC (NC) for 24 h. Then, cells were incubated for another 48 h. After transfection (A, B) the cell cycle distribution in G0/G1, S, and G2 phase after propidium iodide staining of GBC cells were determined by FACS. (C) Expressions of cleaved caspase3, p27 Kip1, CDK2, and cyclin E1 in GBC-SD cells were detected with Western blotting. (D–G) The relative expressions of cleaved caspase3, p27 Kip1, CDK2, and cyclin E1 in GBC-SD cells were quantified via normalization to β-actin. Each group were performed at least three independent experiments. **P<0.01 vs control group.
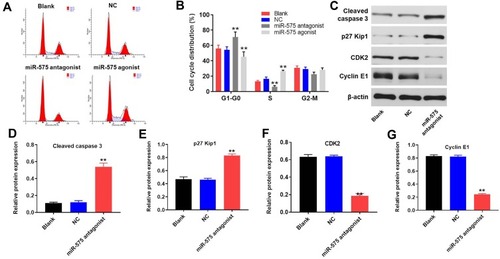
Figure 5 Downregulation of miR-575 inhibited tumor growth of GBC in vivo. GBC-SD cells were subcutaneously injected into nude mice to establish tumor xenograft model. MiR-575 antagonist or vector control was directly injected into the tumors twice a week. (A) Tumor volumes of mice were measured weekly. (B) At the end of the study, tumor tissues of mice were collected and pictured. (C) Tumor weights in each group of mice were calculated. (D) The level of p27 Kip1 in tumor tissues was detected using qRT-PCR. Each group were performed at least three independent experiments. **P<0.01 vs control group.
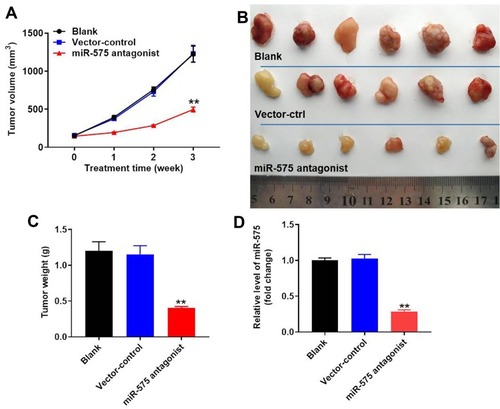
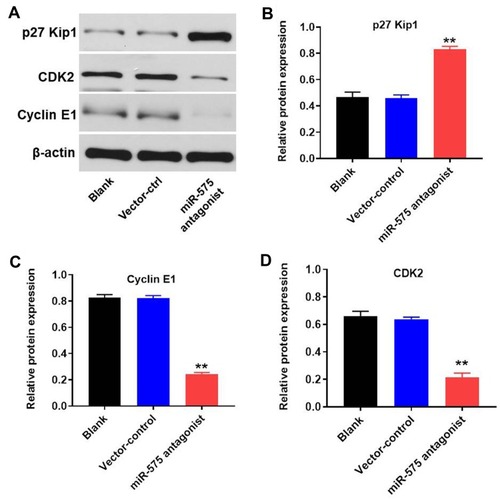
Figure 6 Downregulation of miR-575 inhibited tumor growth of GBC via modulating the expression of cycle-related and pro-apoptosis proteins. (A) The protein expressions of p27 Kip1, CDK2, and cyclin E1 in tumor tissues were detected using Western-blot. (B–D) The relative expressions of p27 Kip1, CDK2, and cyclin E1 in tumor tissues were quantified via normalization to β-actin. Each group were performed at least three independent experiments. **P<0.01 vs control group.