Figures & data
Figure 1 HANR expression is enhanced in HCC-sensitive or -resistant tissues and cells. (A) RT-qPCR shows the expression of HANR in HCC samples and para-tumor normal tissues. (B) CCK‑8 assay shows IC50 value of HepG2, HepG2/sora, Huh7 and Huh7/sora cells. (C) RT-qPCR shows the relative expression levels of HANR in HepG2, HepG2/sora, Huh7 and Huh7/sora cells. (D) RT-qPCR shows the relative expression levels of HANR in HepG2 and Huh7 cells transfected with vector or HANR overexpression plasmid. (E, F) CCK-8 assay shows the effect of HANR overexpression on cell viability in HepG2 and Huh7 cells with HANR transfection and sorafenib treatment. (G) Xenograft assay shows tumor growth and tumor weight was detected at the end point. The data were presented as mean ± SD (*P < 0.05).
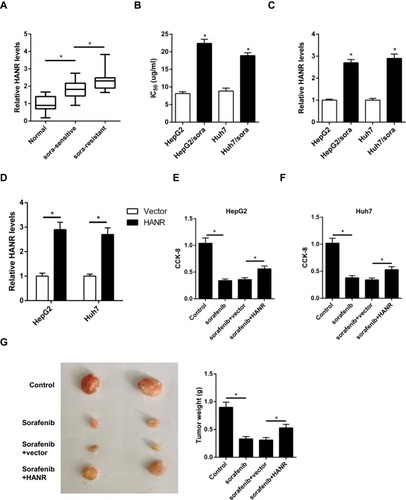
Figure 2 Inhibition of autophagy reduces HANR-regulated sorafenib resistance of HCC cells. (A) CCK-8 assay shows the cell viability of HepG2/sora cells transfected with vector, HANR and HANR+3-MA. (B) CCK-8 assay shows the cell viability of Huh7/sora cells transfected with shNC, shHANR and shHANR+RAP. (C) Western blotting shows the LC3-II/LC3-I protein ratio in HepG2/sora cells transfected with vector, HANR and HANR+3-MA. (D) Western blotting shows the LC3-II/LC3-I protein ratio in Huh7/sora cells transfected with shNC, shHANR and shHANR+RAP. The data were presented as mean ± SD (*P < 0.05).
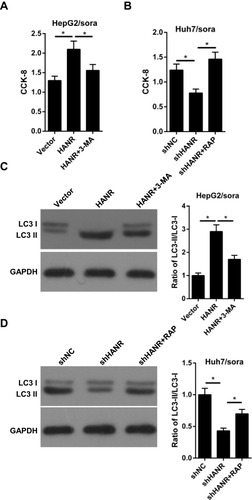
Figure 3 HANR overexpression enhances sorafenib resistance of HCC cells by promoting autophagy. (A) RT-qPCR shows the relative expression levels of HANR in HepG2/sora cells transfected with vector or HANR overexpression plasmid. (B) RT-qPCR shows the relative expression levels of HANR in Huh7/sora cells transfected with shNC or shHANR. (C, D) CCK-8 assay shows the cell viability of HepG2/sora and Huh7/sora cells in different transfected groups. (E, F) Western blotting shows the LC3-II/LC3-I protein ratio in HepG2/sora and Huh7/sora cells in different transfected groups. (G, H) Flow cytometry shows the cell apoptosis rate of HepG2/sora and Huh7/sora cells in different transfected groups. The data were presented as mean ± SD (*P < 0.05).
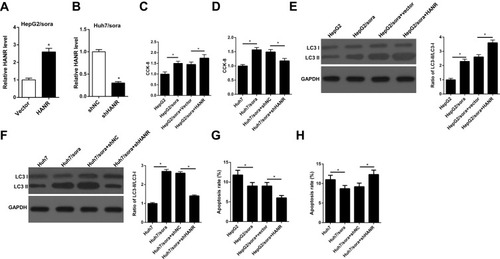
Figure 4 HANR inhibits miR-29b expression by direct interaction. (A) Bioinformatic prediction of binding site of miR-29b by HANR. (B) Luciferase reporter assay shows miR-29b bind to wildtype HANR, not mutant HANR in 293T cells. (C) RT-qPCR shows the expression levels of miR-29b and HANR in HepG2/sora cells transfected with NC, miR-29b mimics or miR-29b inhibitor. The data were presented as mean ± SD (*P < 0.05, **p < 0.01).
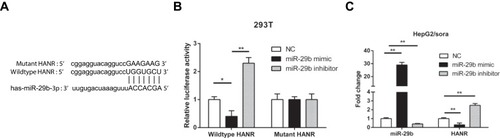
Figure 5 Restoration of miR-29b abrogates HANR-induced sorafenib resistance by inhibiting autophagy in sorafenib-resistant HCC cells. (A) CCK-8 assay shows the cell viability of HepG2/sora cells transfected with vector, HANR, HANR+miR-NC, or HANR+miR-29b. (B) CCK-8 assay shows the cell viability of Huh7/sora cells transfected with shNC, shHANR, shHANR+inh-miR-NC, or shHANR+inh-miR-29b. (C, D) Western blotting shows the LC3-II/LC3-I protein ratio in HepG2/sora and Huh7/sora cells in different transfected groups. The data were presented as mean ± SD (*P < 0.05).
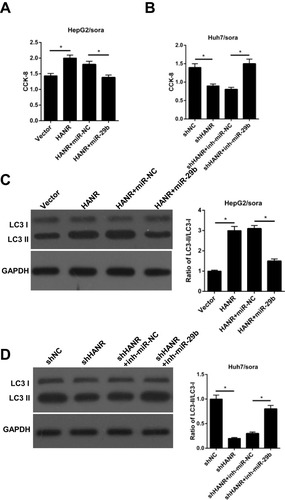
Figure 6 miR-29b enhances sorafenib sensitivity by directly interacting with ATG9A in sorafenib-resistant HCC cells. (A) Predicted binding sites between miR‑29b and the ATG9A 3ʹ‑untranslated region by TargetScan online website. (B) Luciferase reporter assay shows miR-29b bind to wildtype ATG9A, not mutant ATG9A in 293T cells. (C) RT-qPCR shows the relative expression levels of ATG9A in HepG2 and Huh7 cells transfected with vector or ATG9A. (D, E) CCK-8 assay shows the effect of ATG9A overexpression on cell viability in HepG2 and Huh7 cells with ATG9A transfection and sorafenib treatment. (F) RT-qPCR shows the relative expression of HepG2/sora cells transfected with miR-NC, miR-29b, miR-29b+pcDNA, or miR-30b+ATG9A. (G) RT-qPCR shows the relative expression of Huh7/sora cells transfected with inh-miR-NC, inh-miR-29b, inh-miR-29b+siNC, or inh-miR-29b+si-ATG9A. (H, I) CCK-8 assay shows the cell viability of HepG2/sora and Huh7/sora cells in different transfected groups. (J, K) Western blotting shows the LC3-II/LC3-I protein ratio in HepG2/sora and Huh7/sora cells in different transfected groups. The data were presented as mean ± SD (*P < 0.05).
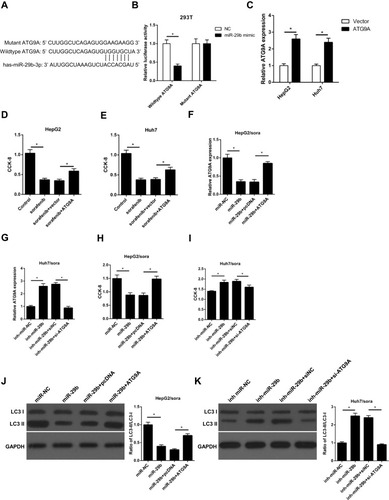
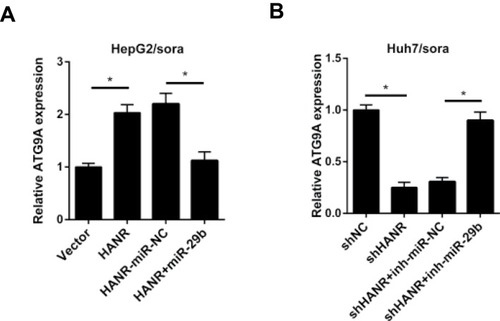
Figure 7 HANR modulates ATG9A expression by sponging miR-29b. (A) RT-qPCR shows the relative expression of ATG9A in HepG2/sora cells transfected with pcDNA, HANR, HANR-miR-NC, or HANR+miR-29b. (B) RT-qPCR shows the relative expression of ATG9A in Huh7/sora cells transfected with shNC, shHANR, shHANR+inh-miR-NC, or shHANR+inh-miR-29b.The data were presented as mean ± SD (*P < 0.05).