Figures & data
Figure 1 Cell proliferation assay by BrdU incorporation.
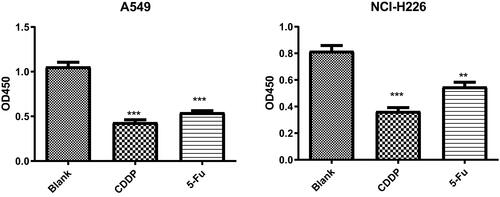
Figure 2 The result of Annexin V/PI experiments on both A549 and NCI-226 cell lines. (A) The cells were measured by flow cytometric analysis. (B) The apoptotic rate. ***P<0.001 vs Blank group
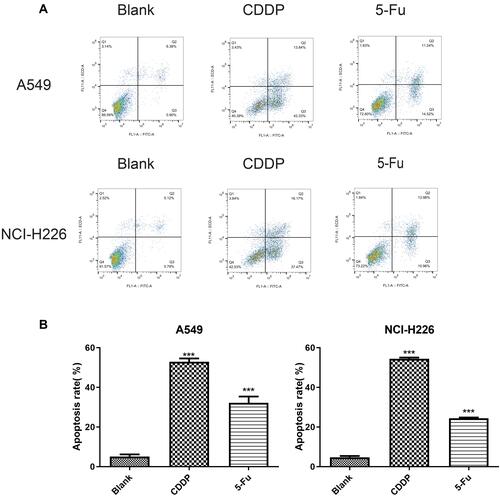
Figure 3 The effect of 5-Fu and CDDP on OCT3/4 expression in A549 and NCI-H226 cells. (A and B) The expression of OCT3/4 (+) cells in A549 and NCI-H226 cells by immunofluorescence analysis, respectively. **P<0.01 vs Blank group.
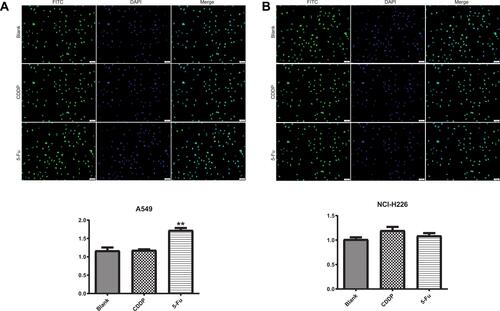
Figure 4 Western blot and qPCR were carried out to detect the expressions of OCT3/4 and Nanog. (A and B) The expressions of OCT3/4 and Nanog in A549 and NCI-H226 cells by Western blot, respectively. (C) The expressions of OCT3/4 and Nanog in A549 and NCI-H226 cells by qPCR. *P<0.05, **P<0.01 and ***P<0.001 vs Blank group.
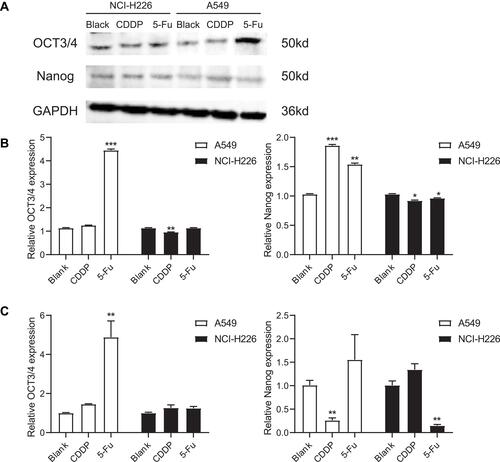
Figure 5 DNA methyltransferase activity. (A and B) The expressions of DNMT1, DNMT3a, DNMT3b and MBD2 in A549 cells and NCI-H226 cells, respectively. *P<0.05 and ***P<0.001 vs Blank group.
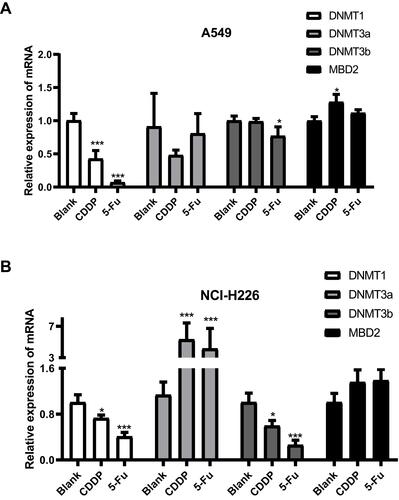
Figure 6 The effects of 5-Fu treatment on the expression of has-miR-134 and has-miR-296. (A and B) The expressions of has-miR-134 and has-miR-296 in A549 cells in A549 cells and NCI-H226 cells, respectively. *P<0.05 and ***P<0.001 vs Blank group.
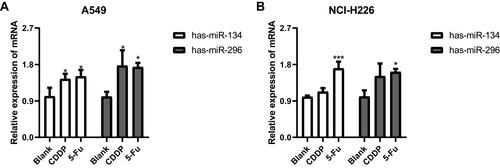
Figure 7 The methylation of OCT3/4 promoter in A549 cells.
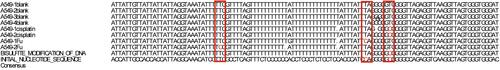
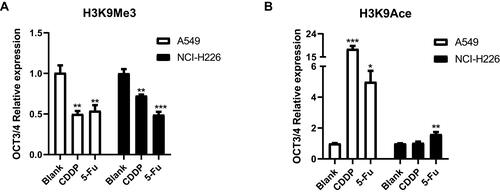
Figure 8 The expression of H3K9Me3 and H3K9Ace by ChIP. (A and B) The expression of H3K9Me3 and H3K9Ace in A549 and NCI-H226 cells, respectively. *P<0.05, **P<0.01 and ***P<0.001 vs Blank group.