Figures & data
Figure 1 KLF16 is a potential oncogene in prostate cancer (PCa). (A, B) Expression of Kruppel-like factors (KLFs) of normal prostate tissues and PCa tissues in The Cancer Genome Atlas (TCGA) and Memorial Sloan Kettering Cancer Center (MSKCC) is shown by a heat map using a classification of differential expression. (C, D) RNA expression of PCa tissues (T) showing KLF16 expression was significantly higher than normal prostate tissues in the TCGA and MSKCC cohorts (t-test; **p < 0.01; ***p < 0.001). (E, F) The plots show significant positive correlations between KLF16 and cell cycle progression in the TCGA or MSKCC datasets (Pearson’s correlation).
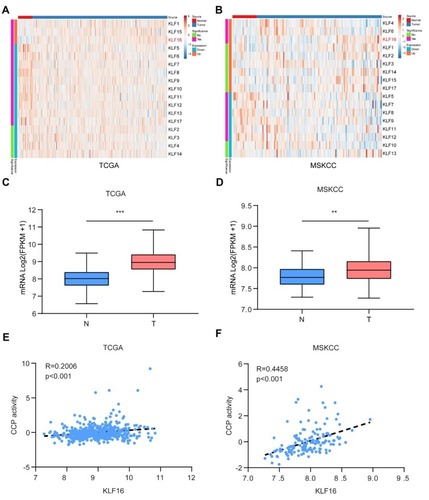
Figure 2 KLF16 expression is upregulated in prostate cancer (PCa). (A) Expression of KLF16 in normal prostate tissues and PCa tissues examined by immunohistochemistry (Mann–Whitney test; ***p < 0.001). (B) Representative photographs of normal prostate tissues and PCa tissues (scale bar: 200 μm).
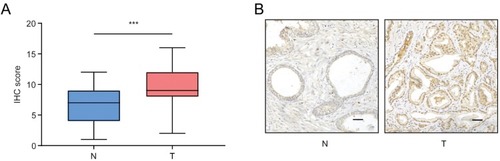
Figure 3 Knockdown of KLF16 inhibits prostate cancer (PCa) cell growth in vitro and in vivo. PC3 and 22RV1 cells were infected by a lentivirus with a short hairpin RNA (shRNA) targeting KLF16 or a control sequence. (A) The efficiency of the shRNA in PCa cells was confirmed by Western blotting. The semi-quantitation of Western blotting was shown under the pictures. (B) PC3 and 22RV1 cells expressing shRNA targeting KLF16 or a control sequence were cultured in 96-well plates for 6 days. The MTT assay was conducted to determine viability of the indicated cells (t-test; *p < 0.05; ***p < 0.001). (C) PC3 and 22RV1 cells expressing their respective shRNAs were examined using a colony formation assay. (D) The numbers of colonies for each group were counted and the results are shown (t-test; ***p < 0.001). (E) The mice with xenograft were shown after implanting PC3 cells 6 weeks later. (F) The weight of the xenograft tumors was calculated. Error bars represent mean ± SD (Mann–Whitney, ** p < 0.01, n = 6).
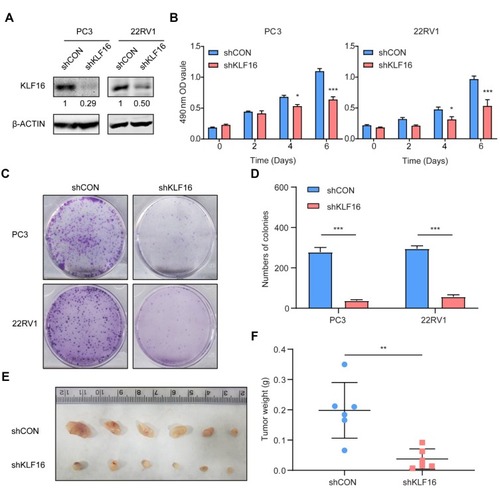
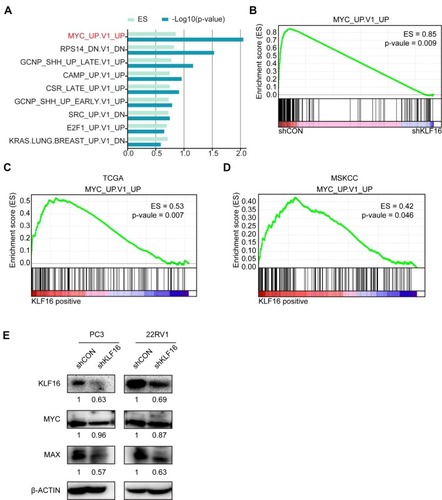
Figure 4 Loss of KLF16 results in inhibition of MYC signaling. (A) Gene set enrichment analysis (GSEA) was performed based on oncogenic signatures that disrupt KLF16 in PC3 cells. The results are shown in rank order of p-value and enrichment scores. (B) GSEA of the profile data inhibiting expression of KLF16 in PC3 cells based on the gene set of MYC signaling in the control (left) and shKLF16 (right). (C, D) GSEA of the TCGA and MSKCC datasets based on the MYC signaling gene set and KLF16 transcription levels. (E) PC3 and 22RV1 cells were infected with the indicated shRNAs virus, and the indicated proteins were detected by Western blot. The semi-quantitation of Western blotting was shown under the pictures.