Figures & data
Table 1 Analysis of the Correlation Between Expression of TUG1 in Acute Myeloid Leukemia and the Clinicopathological Parameters
Figure 1 Upregulated expression level of TUG1 was observed in AML bone marrow or cells. (A) qRT-PCR analysis for TUG1 expression level in AML marrow samples and healthy controls. (AML: 2.821 ± 0.654 VS Normal: 1 ± 0.2599, P<0.0001) (B) TUG1 expression level in AML HL-60 and NB4, as well as normal marrow cells HS-5. (HL-60: 2.467 ± 0.251 VS HS-5: 1 ± 0.24, P=0.0019; NB4: 2.767 ± 0.252 VS HS-5: 1 ± 0.24, P=0.0009).
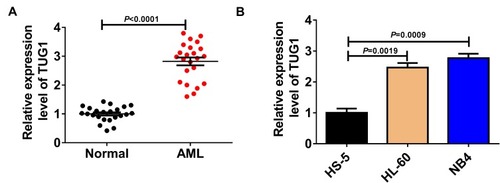
Figure 2 Silencing of TUG1 triggered a cytotoxic effect on AML cells. HL-60 and NB4 cells were transfected with si-NC or si-TUG1 (mixture of si-TUG1#1, si-TUG1#2 and si-TUG1#3). (A) The relative expression level of TUG1 in HL-60 and NB4 cells. (HL-60: si-TUG1 VS si-NC, P=0.0148; NB4: si-TUG1 VS si-NC, P=0.0109) (B, C) The cell viability of transfected HL-60 and NB4 cells. (HL-60: si-TUG1 VS si-NC, P=0.0074; NB4: si-TUG1 VS si-NC, P=0.008) (D) Cell death of transfected HL-60 and NB4 cells at 48-hrs post-transfection. (HL-60: si-TUG1 VS si-NC, P=0.0004; NB4: si-TUG1 VS si-NC, P=0.0004).
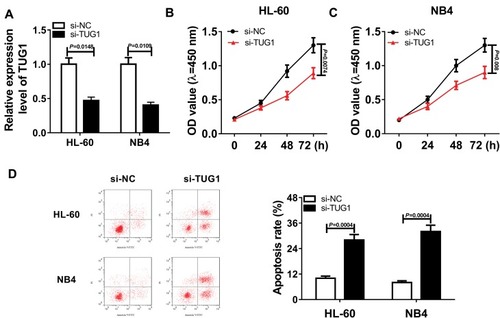
Figure 3 LncRNA TUG1 directly targeted miR-193a-5p. (A) The predicted binding site of miR-193a-5p and TUG1 and the mutant. (B, C) Dual-luciferase reporter assays for HL-60 and NB4 cells transfected with TUG1-WT reporter or TUG1-MUT reporter, as well as miR-193a-5p mimics or miR-NC. (HL-60: miR-193a-5p VS miR-NC, P=0.0066; NB4: miR-193a-5p VS miR-NC, P=0.0046) (D) The expression of miR-193a-5p in AML marrow samples and healthy controls. P < 0.0001 (E) MiR-193a-5p expression in AML HL-60 and NB4 cells, as well as normal marrow cells HS-5. (HL-60 VS HS-5, P=0.0038; NB4 VS HS-5, P=0.002) (F) QRT-PCR assay for miR-193a-5p expression in HL-60 and NB4 cells transfected with TUG1 or pcDNA. (HL-60: TUG1 VS pcDNA, P=0.0062; NB4: TUG1 VS pcDNA, P=0.0038) (G) Pearson correlation analysis for the correlation between relative expression levels of TUG1 and miR-193a-5p in AML bone marrow. r=−0.9108, P < 0.0001.
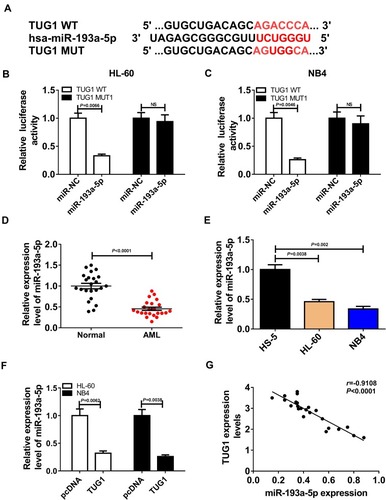
Figure 4 Overexpressed miR-193a-5p induced a cytotoxic effect on AML cells. HL-60 and NB4 cells were transfected with miR-193a-5p mimics or miR-NC mimics. (A) The relative expression level of miR-193a-5p in transfected AML cells. (HL-60: miR-193a-5p VS miR-NC, P=0.003; NB4: miR-193a-5p VS miR-NC, P=0.0013) (B, C) CCK-8 assay for transfected HL-60 and NB4 cells. (HL-60: miR-193a-5p VS miR-NC, P=0.0062; NB4: miR-193a-5p VS miR-NC, P=0.0053) (D) Cell apoptosis assay for transfected HL-60 and NB4 cells. (HL-60: miR-193a-5p VS miR-NC, P=0.0005; NB4: miR-193a-5p VS miR-NC, P=0.0002).
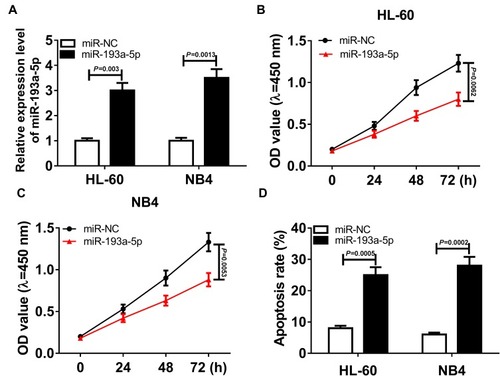
Figure 5 TUG1 regulated the cell viability and death of AML cells through targeting miR-193a-5p. (A) HL-60 and NB4 cells were transfected with in-miR-193a-5p or in-miR-NC. The relative expression level of miR-193a-5p after transfection. (HL-60: in-miR-193a-5p VS in-miR-NC si-NC 97; NB4: in-miR-193a-5p VS in-miR-NC, P=0.0056) (B, D) HL-60 and NB4 cells were transfected with si-NC, si-TUG1, si-TUG1 + in-miR-NC or si-TUG1 + in-miR-193a-5p. (B, C) CCK-8 assay for transfected HL-60 and NB4 cells. (HL-60: si-TUG1 VS si-NC, P=0.0062; HL-60: si-TUG1 + in-miR-193a-5p VS si-TUG1 + in-miR-NC, P=0.0192; NB4: si-TUG1 VS si-NC, P=0.0074; NB4: si-TUG1 + in-miR-193a-5p VS si-TUG1 + in-miR-NC, P=0.0106) (D) Cell apoptosis assay for transfected HL-60 and NB4 cells. (HL-60: si-TUG1 VS si-NC, P=0.0005; HL-60: si-TUG1 + in-miR-193a-5p VS si-TUG1 + in-miR-NC, P=0.0008; NB4: si-TUG1 VS si-NC, P=0.0001; NB4: si-TUG1 + in-miR-193a-5p VS si-TUG1 + in-miR-NC, P=0.001).
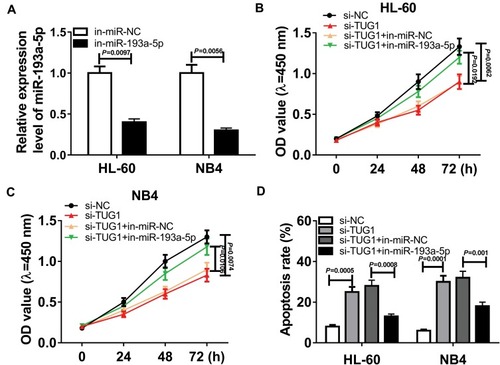
Figure 6 MiR-193a-5p targeted and negatively regulated Rab10. (A) The putative binding site of miR-145-5p on 3ʹUTR of Rab10 predicted by DIANA TOOLS and the mutant. (B, C) Dual-luciferase reporter assays for HL-60 and NB4 cells transfected with Rab10-WT reporter or Rab10-MUT reporter, as well as miR-193a-5p mimics or miR-NC mimics. (HL-60: miR-193a-5p VS miR-NC, P=0.0131; NB4: miR-193a-5p VS miR-NC, P=0.0097) (D) The level of Rab10 in AML samples and healthy controls detected by the qRT-PCR assay. *P < 0.0001 (E) Rab10 expression level evaluated via qRT-PCR assay. (HL-60 VS HS-5, P=0.0032; NB4 VS HS-5, P=0.0006) (F) Western blot assay for Rab10 expression in HL-60 and NB4 cells transfected with miR-193a-5p mimics or miR-NC mimics. (HL-60: miR-193a-5p VS miR-NC, P=0.0073; NB4: miR-193a-5p VS miR-NC, P=0.0044) (G) Western blot assay for Rab10 expression in HL-60 and NB4 cells transfected with si-TUG1 or si-NC. (HL-60: si-TUG1 VS si-NC, P=0.0066; NB4: si-TUG1 VS si-NC, P=0.0044) (H) Pearson correlation analysis for the correlation between relative expression levels of Rab10 and miR-193a-5p in AML bone marrow samples. r=−0.8936, P < 0.0001. (I) Pearson correlation analysis for the correlation between relative expression levels of Rab10 and TUG1 in AML bone marrow samples. r=0.8943, P < 0.0001.
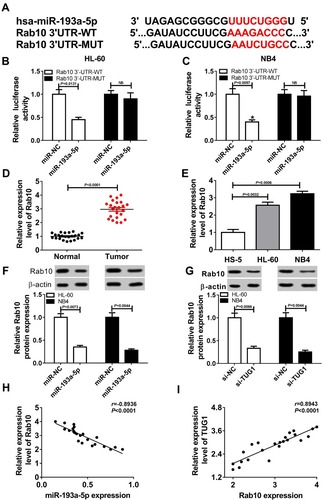
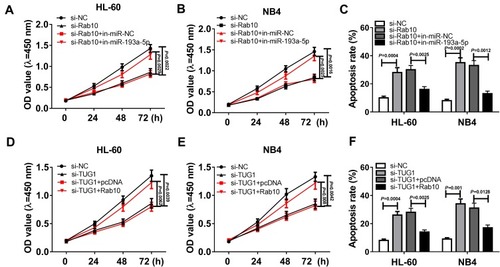
Figure 7 TUG1 regulated the cell viability and death of AML cells through regulating miR-139a-5p/Rab10 axis. (A–C) HL-60 and NB4 cells were transfected with si-NC, si-Rab10, si-Rab10+ in-miR-NC or si-Rab10 + in-miR-193a-5p. (A, B) CCK-8 assay for transfected HL-60 and NB4 cells. (HL-60: si-Rab10 VS si-NC, P=0.0022; HL-60: si-Rab10 + in-miR-193a-5p VS si-Rab10+ in-miR-NC, P=0.0029; NB4: si-Rab10 VS si-NC, P=0.0016; NB4: si-Rab10 + in-miR-193a-5p VS si-Rab10+ in-miR-NC, P=0.0025) (C) Death of HL-60 and NB4 cells after transfection. (HL-60: si-Rab10 VS si-NC, P=0.0004; HL-60: si-Rab10 + in-miR-193a-5p VS si-Rab10+ in-miR-NC, P=0.0025; NB4: si-Rab10 VS si-NC, P=0.0002; NB4: si-Rab10 + in-miR-193a-5p VS si-Rab10+ in-miR-NC, P=0.0012) (D–F) HL-60 and NB4 cells were transfected with si-NC, si-TUG1, si-TUG1 + pcDNA or si-TUG1 + Rab10. (D–E) The cell viability of transfected HL-60 and NB4 cells measured by CCK-8 assay. (HL-60: si-TUG1 VS si-NC, P=0.0039; HL-60: si-TUG1 + Rab10 VS si-TUG1 + pcDNA, P=0.0062; NB4: si-TUG1 VS si-NC, P=0.0042; NB4: si-TUG1 + Rab10 VS si-TUG1 + pcDNA, P=0.008) (F) Death of transfected HL-60 and NB4 cells. (HL-60: si-TUG1 VS si-NC, P=0.0004; HL-60: si-TUG1 + Rab10 VS si-TUG1 + pcDNA, P=0.0025; NB4: si-TUG1 VS si-NC, P=0.001; NB4: si-TUG1 + Rab10 VS si-TUG1 + pcDNA, P=0.0128).