Figures & data
Figure 1 TET enhanced the anti-proliferation effect of PTX in SKOV3/PTX cells. (A) CCK-8 assay was used to detect the cell viability. SKOV3 cells were treated with 0, 0.01, 0.05, 0.2, or 1 μM PTX for 72 h. SKOV3/PTX cells were treated with 0, 0.05, 0.2, 1, 10, 20 or 50 μM PTX for 72 h. (B) SKOV3/PTX cells were treated with 0, 1, 2, 4 or 8 μM TET for 72 h. (C) SKOV3/PTX cells were treated with PTX (1 μM) and TET (0, 1, 2 or 4 μM) for 72 h. (D, E) SKOV3/PTX cells were treated with PTX (1 μM) or/and 2 μM TET for 72 h. Quantification of Ki67 expression by immunofluorescence in SKOV3/PTX cells. *P<0.05, **P<0.01 compared with control group; #P<0.05, ##P<0.01 compared with PTX_1 μM group.
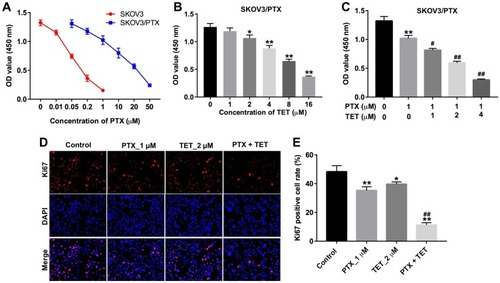
Table 1 Evaluation of Combination of PTX with TET in Ovarian Cancer (72 h Treatment)
Figure 2 TET enhanced the pro-apoptotic effect of PTX in SKOV3/PTX cells. SKOV3/PTX cells were treated with PTX (1 μM) or/and 2 μM TET for 72 h. (A, B) Apoptotic cells were detected by Annexin V/PI double staining and flow cytometry in SKOV3/PTX cells. (C) JC-1 staining was used to determine MMP loss. (D) Expression levels of Bax, Bcl-2 and cleaved caspase 3 in SKOV3/PTX cells were detected with Western blotting. (E–G) The relative expressions of Bax, Bcl-2 and cleaved caspase 3 were quantified via normalization to β-actin. *P<0.05, **P<0.01 compared with control group; ##P<0.01 compared with PTX_1 μM group.
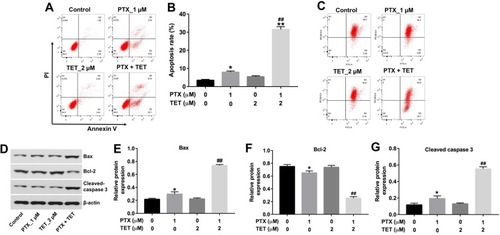
Figure 3 TET enhanced the anti-migratory effect of PTX in SKOV3/PTX cells. SKOV3/PTX cells were treated with PTX (1 μM) or/and 2 μM TET for 72 h. (A, B) Cell migration was determined by wound healing assay. **P<0.01 compared with control group; ##P<0.01 compared with PTX_1 μM group.
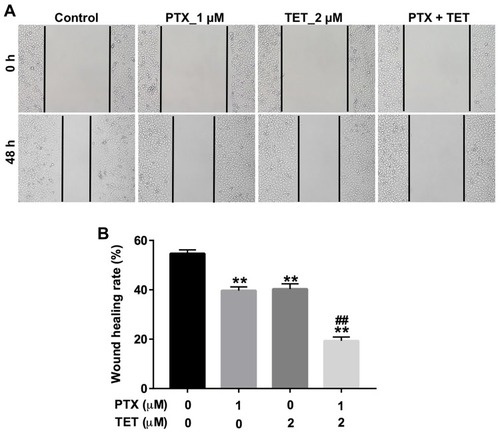
Figure 4 TET enhanced the sensitivity of SKOV3/PTX cells to PTX by inhibiting the β-catenin/c-Myc/Cyclin D1 signaling pathway. SKOV3/PTX cells were treated with PTX (1 μM) or/and 2 μM TET for 72 h. (A, B) Flow cytometry was used to measure cell cycle phase. (C) Expression levels of c-Myc, cyclin D1 and p21 in SKOV3/PTX cells were detected with Western blotting. (D–G) The relative expressions of β-catenin, c-Myc, cyclin D1 and p21 were quantified via normalization to β-actin. *P<0.05, **P<0.01 compared with control group; ##P<0.01 compared with PTX_1 μM group.
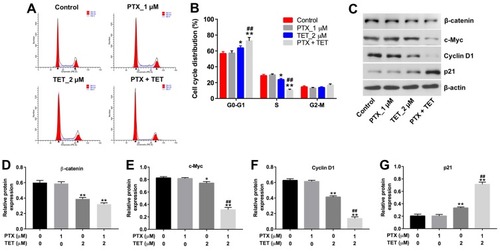
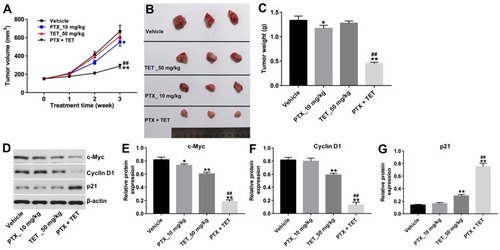
Figure 5 TET enhanced anti-tumor effect of PTX in SKOV3/PTX xenograft. SKOV3/PTX cells were transplanted subcutaneously into nude mice to establish a xenograft model of ovarian cancer. (A) Subcutaneous tumor xenograft volumes were monitored and measured weekly. (B) Representative photographs of SKOV3/PTX xenograft tumor were captured on day 21. (C) Tumor weights in each group were calculated. (D) Expression levels of c-Myc, cyclin D1 and p21 in tumor tissues were detected with Western blotting. (E–G) The relative expressions of c-Myc, cyclin D1 and p21 were quantified via normalization to β-actin. *P<0.05, **P<0.01 compared with vehicle group; ##P<0.01 compared with PTX_10 mg/kg group.