Figures & data
Figure 1 Berberine inhibited the viability of hepatocellular carcinoma cells. (A) The effect of different concentrations of berberine on the viability of Hep3B and BEL-7404 cells after 48 hrs. (B) The effect of different treatment times of berberine on the viability of Hep3B and BEL-7404. (C) The effect of different doses of berberine on the colony formation of Hep3B and BEL-7404 cells. (D) The EdU staining of Hep3B and BEL-7404 after berberine treatment for 48 hrs. *P<0.05; **P<0.01; ***P<0.001.
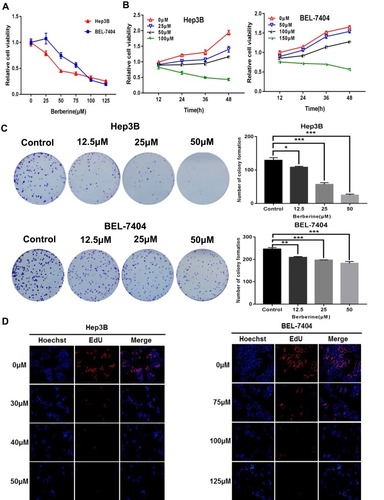
Figure 2 Berberine suppressed the glutamine uptake and inhibited the SLC1A5 expression. (A) The concentration of glutamine, glutamate and glycine in Hep3B and BEL-7404 cells after treatment with berberine for 48 hrs. (B) The extracted ion chromatographs (EICs) from a standard solution, and a sample of the targeted analytes under optimal conditions. (C) The SLC1A5, GLS, PHGDH and PSPH expression in berberine-treated Hep3B and BEL-7404 cells. (D) The glutamine uptake rates in Hep3B and BEL-7404 cells after treatment with berberine for 48 hrs. (E) The immunofluorescent images depicting the SLC1A5 expression in berberine-treated Hep3B and BEL-7404 cells. *P<0.05; **P<0.01; ***P<0.001.
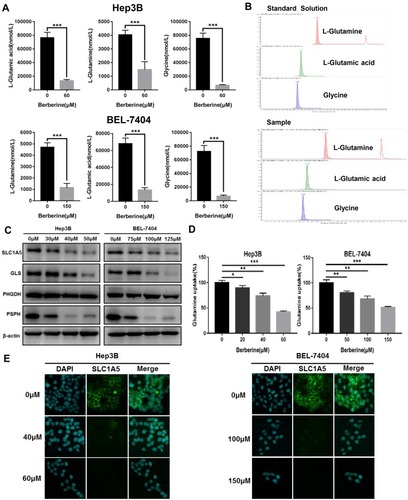
Figure 3 The SLC1A5 upregulation increased the glutamine uptake and improved berberine tolerance. (A) The SLC1A5 expression in Hep3B and BEL-7404 cells transduced with the SLC1A5-lentivirus or a negative control was analyzed by Western blot. (B) The glutamine uptake rates in the SLC1A5 group and NC group. (C) The effect of the transfection with SLC1A5 on cell viability in the condition of berberine treatment. (D) The EdU staining in the SLC1A5 group and NC group after berberine treatment for 48 hrs. *P<0.05; **P<0.01; ***P<0.001.
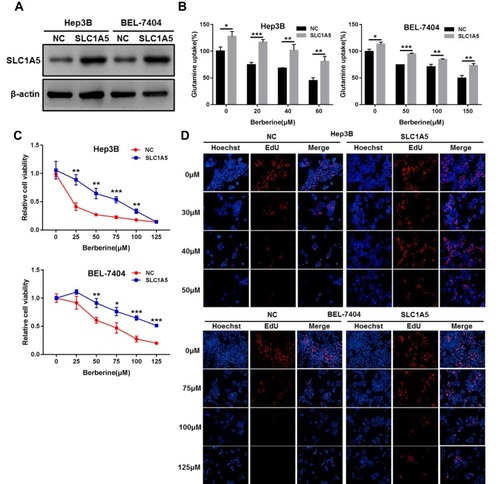
Figure 4 Berberine suppressed c-Myc, and the upregulation of c-Myc reversed the SLC1A5 inhibition of berberine. (A) The c-Myc expression in berberine-treated Hep3B and BEL-7404 cells. (B) The immunofluorescent images depicting the c-Myc expression in berberine-treated Hep3B and BEL-7404 cells. (C) The c-Myc and SLC1A5 expression in Hep3B and BEL-7404 cells transduced with the c-Myc-lentivirus or a negative control was analyzed by Western blot. (D) The Hep3B and BEL-7404 cells transduced with c-Myc-lentivirus or a negative control after gradient berberine treatment for 48 hrs was analyzed by Western blot. (E) The upregulation of c-Myc enhancing berberine tolerance (F) The EdU staining in the c-Myc group and NC group after berberine treatment for 48 hrs. *P<0.05; **P<0.01; ***P<0.001.
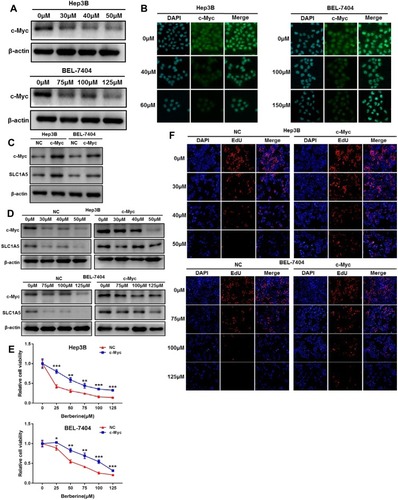
Figure 5 Berberine inhibited the growth of tumor xenografts in vivo. (A) An image of nude mice that were sacrificed to form the xenograft tumor model by subcutaneously injecting Hep3B cells. (B) The growth curve of tumor volumes in the berberine-treated group and control group. (C) The analysis of body weight alterations. (D) The representative immunohistochemical staining of SLC1A5. (E) The representative immunohistochemical staining of c-Myc. **P<0.01; ***P<0.001.
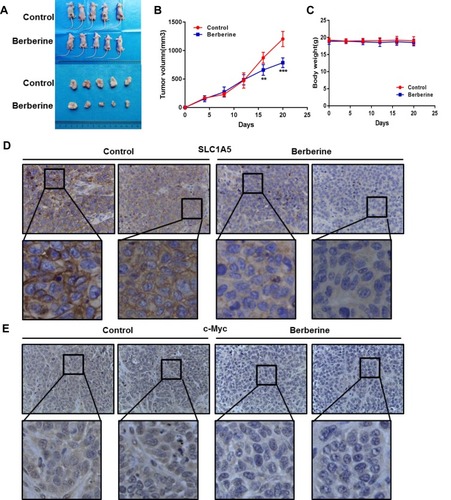
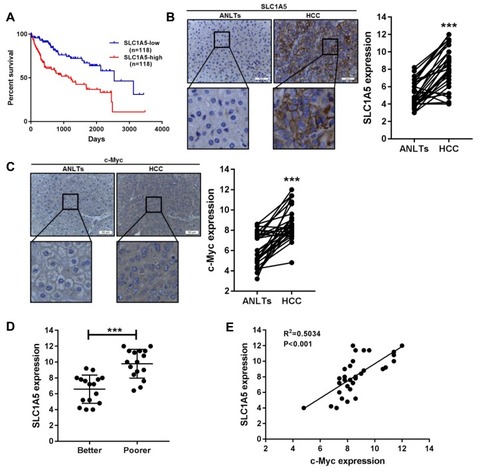
Figure 6 The overexpression of SLC1A5 was associated with worse clinical outcome in HCC. (A) The comparison of the survival of patients with high SLC1A5 expression (SLC1A5-High, n=118) and low SLC1A5 expression (SLC1A5-Low, n=118) using data obtained from The Cancer Genome Atlas (TCGA). (B) The SLC1A5 expression in HCC tissues and adjacent non-tumor liver tissues (ANLTs). (C) The c-Myc expression in HCC tissues and ANLTs. (D) The SLC1A5 expression levels assessed in human HCC tissues characterized by better or poorer prognosis. (E) The Pearson’s correlation coefficient between c-Myc and SLC1A5. ***P<0.001.